Unlock a world of possibilities! Login now and discover the exclusive benefits awaiting you.

- Qlik Community
- :
- Forums
- :
- Analytics & AI
- :
- Products & Topics
- :
- Visualization and Usability
- :
- Qlik Sense - Using 2 variables on X Axis for Scatt...
- Subscribe to RSS Feed
- Mark Topic as New
- Mark Topic as Read
- Float this Topic for Current User
- Bookmark
- Subscribe
- Mute
- Printer Friendly Page

 nr_vk
nr_vk
- Mark as New
- Bookmark
- Subscribe
- Mute
- Subscribe to RSS Feed
- Permalink
- Report Inappropriate Content
Qlik Sense - Using 2 variables on X Axis for Scatter Plot
Hi!
I am new to Qlik Sense. I am planning to display a scatter plot that shows number of jobs/task executed and the exact time the job starts. I am currently doing it but now Im stuck. Ive tried nested if statements, bucket and changing the format for x-axis but none works well.
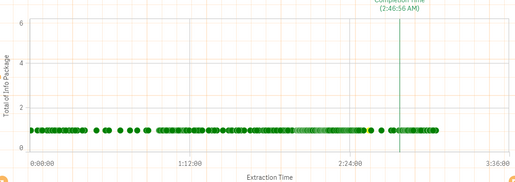
For y axis, i used the number of jobs/task and for x-axis, im using the time in format of hh:mm:ss. My problem is I would like the graph to display the time starts in hour format ('hh:00:00' to show intervals of hourly) and when mouse cursor over the bubble in scatter plot, it should display the exact start time of the task ('hh:mm:ss').
Is it possible to use one measurement for x-axis and another of the bubble?
Attachment provided is currently how my graph looks like with start time as the x-axis ('hh:mm:ss').


- Mark as New
- Bookmark
- Subscribe
- Mute
- Subscribe to RSS Feed
- Permalink
- Report Inappropriate Content
What you have tried? Can you post nested expression with us and What are you trying with that expression.
