Unlock a world of possibilities! Login now and discover the exclusive benefits awaiting you.

- Qlik Community
- :
- Forums
- :
- Analytics & AI
- :
- Products & Topics
- :
- Visualization and Usability
- :
- Re: Qlik sense line chart - hide dimension null va...
- Subscribe to RSS Feed
- Mark Topic as New
- Mark Topic as Read
- Float this Topic for Current User
- Bookmark
- Subscribe
- Mute
- Printer Friendly Page

 gal_polak
- Mark as New
- Bookmark
- Subscribe
- Mute
- Subscribe to RSS Feed
- Permalink
- Report Inappropriate Content
Qlik sense line chart - hide dimension null values
Hi,
I've created a line chart with two dimensions:
1. for dates - x axis.
2. for properties - different line per property.
i'm using the following "if" statement in the properties dimension:
=if([Property Name]='Seniority',[Property Value])
because i would like to get only property values that are related to the specific property name,
but as you can see below what happens is that i have a third line (gray) for total performance of all the others:
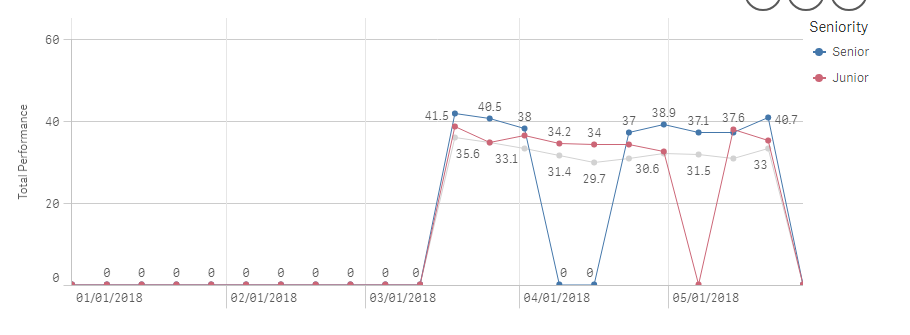
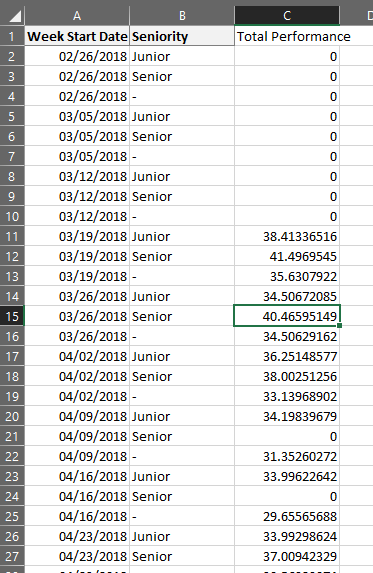
is there a way to hide the gray line?
i would like to avoid adding statements to the measure (total performance) .
Accepted Solutions
gal_polak
- Mark as New
- Bookmark
- Subscribe
- Mute
- Subscribe to RSS Feed
- Permalink
- Report Inappropriate Content
Hi guys,
thx for the comments,
so the right answer was to disable the "Continuous" auto in the X-axis
and then I was able to uncheck the "Include null values".

 thkarner
- Mark as New
- Bookmark
- Subscribe
- Mute
- Subscribe to RSS Feed
- Permalink
- Report Inappropriate Content
Hi, try the following:
Let the dimensions as they are, first date, second Property name (without if).
The measure you should define with set analysis like:
SUM( {<[Seniority]={'Senior', 'Junior'}>} [Property Value])
This should only show values where Seniority is equal Senior or Junior.
BR Thomas
 NZFei
NZFei
- Mark as New
- Bookmark
- Subscribe
- Mute
- Subscribe to RSS Feed
- Permalink
- Report Inappropriate Content
Uncheck "Include null values" in the second dimension settings.
 gal_polak
- Mark as New
- Bookmark
- Subscribe
- Mute
- Subscribe to RSS Feed
- Permalink
- Report Inappropriate Content
Hi guys,
thx for the comments,
so the right answer was to disable the "Continuous" auto in the X-axis
and then I was able to uncheck the "Include null values".
