Unlock a world of possibilities! Login now and discover the exclusive benefits awaiting you.
Announcements
Q&A with Qlik - Qlik Cloud Migration: Questions about migrating to Qlik Cloud? Catch the latest replay!
- Qlik Community
- :
- Forums
- :
- Analytics & AI
- :
- Products & Topics
- :
- Visualization and Usability
- :
- Re: QlikSense Set Color by Measure & Remove Grid L...
Options
- Subscribe to RSS Feed
- Mark Topic as New
- Mark Topic as Read
- Float this Topic for Current User
- Bookmark
- Subscribe
- Mute
- Printer Friendly Page
Turn on suggestions
Auto-suggest helps you quickly narrow down your search results by suggesting possible matches as you type.
Showing results for
Partner - Creator
2017-04-30
02:46 AM
- Mark as New
- Bookmark
- Subscribe
- Mute
- Subscribe to RSS Feed
- Permalink
- Report Inappropriate Content
QlikSense Set Color by Measure & Remove Grid Line In Combo Chart
Hi,
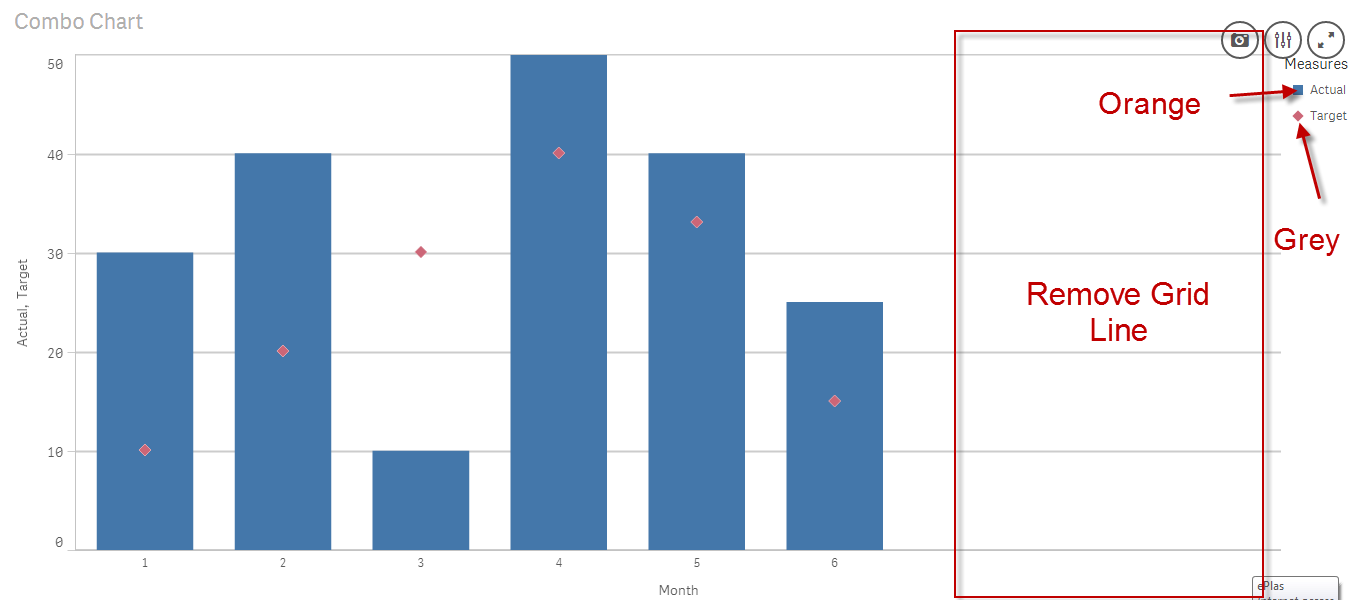
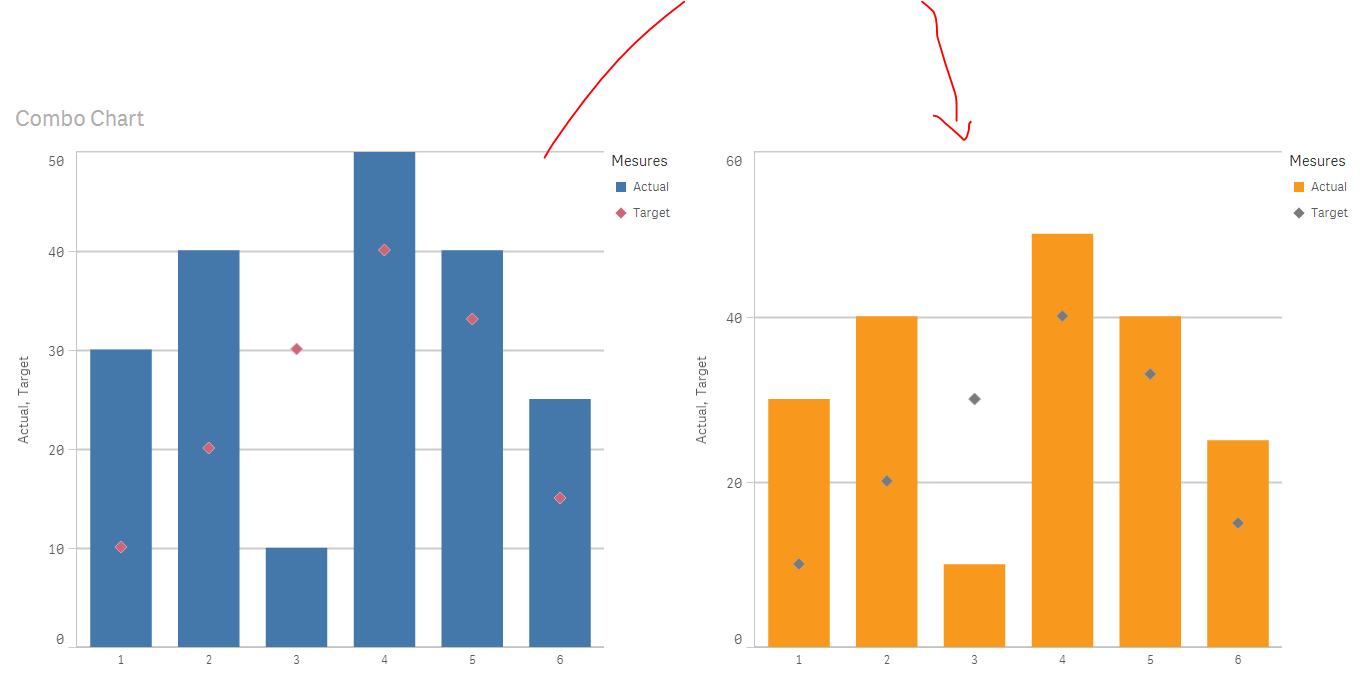
May I know how to set color by measure & and how do remove grid line from Combo Chart in QlikSense
Example - Target marker show in Grey, Actual show in Orange.
Attached QVF. Please assists thanks!
2,120 Views
1 Solution
Accepted Solutions
Partner - Champion II
2017-04-30
11:51 AM
- Mark as New
- Bookmark
- Subscribe
- Mute
- Subscribe to RSS Feed
- Permalink
- Report Inappropriate Content
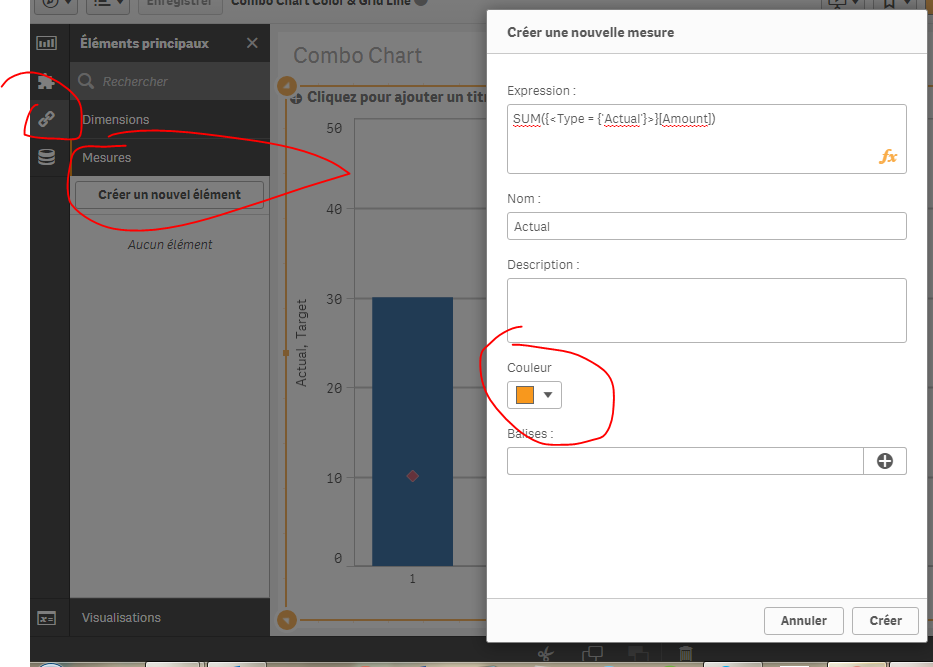
Create your measures as master measures and affect colors to them:
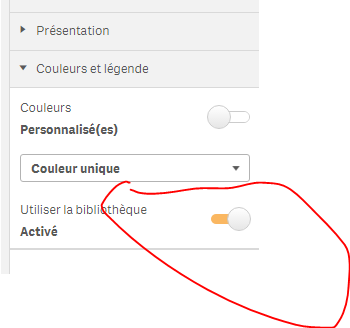
Use your new master measures as measures of your chart, then under aspect, color as follow:
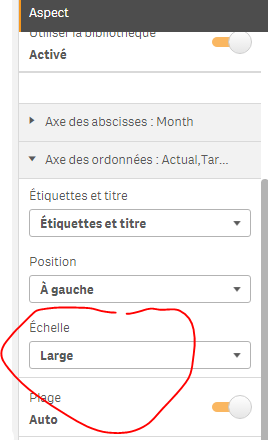
As for the grid, you can't eliminate it, but you can wide it:
Result:
1,754 Views
1 Reply
Partner - Champion II
2017-04-30
11:51 AM
- Mark as New
- Bookmark
- Subscribe
- Mute
- Subscribe to RSS Feed
- Permalink
- Report Inappropriate Content
Create your measures as master measures and affect colors to them:
Use your new master measures as measures of your chart, then under aspect, color as follow:
As for the grid, you can't eliminate it, but you can wide it:
Result:
1,755 Views