Unlock a world of possibilities! Login now and discover the exclusive benefits awaiting you.

- Qlik Community
- :
- Forums
- :
- Analytics & AI
- :
- Products & Topics
- :
- Visualization and Usability
- :
- Re: Qliksense
- Subscribe to RSS Feed
- Mark Topic as New
- Mark Topic as Read
- Float this Topic for Current User
- Bookmark
- Subscribe
- Mute
- Printer Friendly Page

- Mark as New
- Bookmark
- Subscribe
- Mute
- Subscribe to RSS Feed
- Permalink
- Report Inappropriate Content
Qliksense
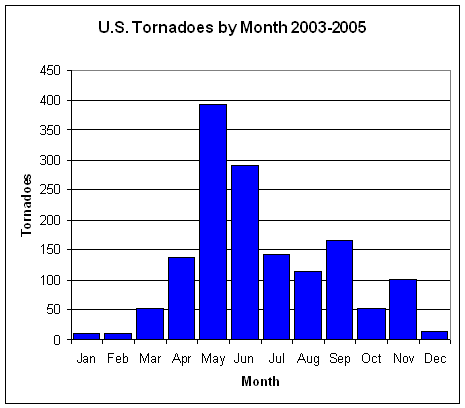
In the above graph, when I click on June, graph should show June along with the previous months (Jan-June). Can someone tell me how this can be done?
Thanks
- « Previous Replies
-
- 1
- 2
- Next Replies »

 danansell42
- Mark as New
- Bookmark
- Subscribe
- Mute
- Subscribe to RSS Feed
- Permalink
- Report Inappropriate Content
You dont need a filter pane, by clicking June on the chart it has the same effect of applying a filter for June.
Not sure what your screen shot is trying to say?
Doesn't look like the data i put into my qvf
- Mark as New
- Bookmark
- Subscribe
- Mute
- Subscribe to RSS Feed
- Permalink
- Report Inappropriate Content
You dont need a filter pane, by clicking June on the chart it has the same effect of applying a filter for June. - YES!
Can u plz work on the sample data below and help me out?
| Month | Tornadoes |
| Jan | 0 |
| Feb | 50 |
| Mar | 100 |
| Apr | 150 |
| May | 200 |
| Jun | 250 |
| Jul | 300 |
| Aug | 350 |
danansell42
- Mark as New
- Bookmark
- Subscribe
- Mute
- Subscribe to RSS Feed
- Permalink
- Report Inappropriate Content
Hi
Please find attached app with revised data
If this resolves your query please mark as correct and/or helpful
Thanks
Dan
- « Previous Replies
-
- 1
- 2
- Next Replies »