Unlock a world of possibilities! Login now and discover the exclusive benefits awaiting you.
- Qlik Community
- :
- Forums
- :
- Analytics & AI
- :
- Products & Topics
- :
- Visualization and Usability
- :
- Re: Question on Qlik Sense graph & measurement
- Subscribe to RSS Feed
- Mark Topic as New
- Mark Topic as Read
- Float this Topic for Current User
- Bookmark
- Subscribe
- Mute
- Printer Friendly Page
- Mark as New
- Bookmark
- Subscribe
- Mute
- Subscribe to RSS Feed
- Permalink
- Report Inappropriate Content
Question on Qlik Sense graph & measurement
Hi I have a problem on Qlik Sense.
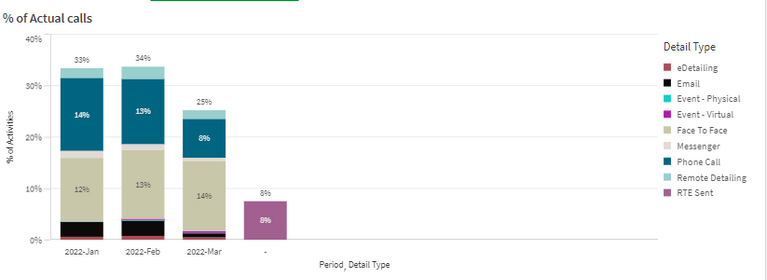
I have created this graph in Qlik Sense.
Measurement is
Count(distinct{<[Call Status]={'COMPLETE','SENT'}>} [Call ID])/
Count(distinct total{<[Call Status]={'COMPLETE','SENT'}>}[Call ID])
Dimension are [Call End Date.autoCalendar.YearMonth] and [Detail Type].
[Detail Type] show each activity of each Call.
In the graph, it calculates total activity (100%) from the data of 3 months sum together.
However, I want my graph to show total activity for each month = 100%.
How should I revise my measurement?
Could you please help advise? Thanks.
- Subscribe by Topic:
-
dimension
-
expression
-
General Question
-
Set Analysis
-
Visualization
- Mark as New
- Bookmark
- Subscribe
- Mute
- Subscribe to RSS Feed
- Permalink
- Report Inappropriate Content
Try below
Count({<[Call Status]={'COMPLETE','SENT'}>}distinct [Call ID])/
Count(TOTAL <Period> {<[Call Status]={'COMPLETE','SENT'}>}distinct [Call ID])
If a post helps to resolve your issue, please accept it as a Solution.
