Unlock a world of possibilities! Login now and discover the exclusive benefits awaiting you.
- Qlik Community
- :
- Forums
- :
- Analytics & AI
- :
- Products & Topics
- :
- Visualization and Usability
- :
- Rank within group
- Subscribe to RSS Feed
- Mark Topic as New
- Mark Topic as Read
- Float this Topic for Current User
- Bookmark
- Subscribe
- Mute
- Printer Friendly Page
- Mark as New
- Bookmark
- Subscribe
- Mute
- Subscribe to RSS Feed
- Permalink
- Report Inappropriate Content
Rank within group
Hi,
I'm trying to produce a table that shows ranks within group. Take the data below:
| Office | Group | Score |
|---|---|---|
| 1 | A | 5 |
| 2 | A | 9 |
| 3 | A | 1 |
| 4 | B | 10 |
| 5 | B | 19 |
| 6 | B | 5 |
| 7 | B | 3 |
| 8 | B | 4 |
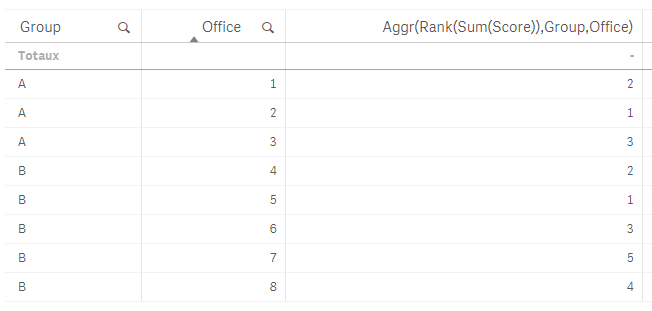
I haven't been able to produce rank within group. For example, the rank for Office 2 should be 1 because they are the top office in Group A even though there are two offices in Group B with a better score.
I need to be able to do this even if Group is not part of the visualization, if that makes a difference.
I'm guessing the solution requires AGGR but I haven't been able to get it to work.
Can anyone help? Thanks in advance!
Lucas
Accepted Solutions
- Mark as New
- Bookmark
- Subscribe
- Mute
- Subscribe to RSS Feed
- Permalink
- Report Inappropriate Content
No Beck, that won't achieve what's he's looking for:
this will do it:
Aggr(Rank(Sum(Score)),Group,Office)
result:
- Mark as New
- Bookmark
- Subscribe
- Mute
- Subscribe to RSS Feed
- Permalink
- Report Inappropriate Content
Hi,
May be simple table wih
Dimehsion: Office
Exprssion: Rank(Sum(Score), 4)
Regards,
Andrey
- Mark as New
- Bookmark
- Subscribe
- Mute
- Subscribe to RSS Feed
- Permalink
- Report Inappropriate Content
It looks like that returns the rank for the whole table, not within group. In my example, that would return a rank of 3 for office 2.
- Mark as New
- Bookmark
- Subscribe
- Mute
- Subscribe to RSS Feed
- Permalink
- Report Inappropriate Content
Hi Lukas,
try it:
Aggr(Rank(Sum({1}Score)),Office) or Aggr(Rank(Sum({1}Score)),Group)
beck
- Mark as New
- Bookmark
- Subscribe
- Mute
- Subscribe to RSS Feed
- Permalink
- Report Inappropriate Content
No Beck, that won't achieve what's he's looking for:
this will do it:
Aggr(Rank(Sum(Score)),Group,Office)
result:
- Mark as New
- Bookmark
- Subscribe
- Mute
- Subscribe to RSS Feed
- Permalink
- Report Inappropriate Content
try this expression
=rank(sum(total <Office,Group>Score),0,1)

- Mark as New
- Bookmark
- Subscribe
- Mute
- Subscribe to RSS Feed
- Permalink
- Report Inappropriate Content
Omar - thanks, that worked! I swear I tried that yesterday but apparently not. I'm having a related issue now - maybe you can help? This formula correctly assigns rank to all selections but does not assign a value to non-selected values. This is important because my visualization basically constructs comparison groups based on the selection - e.g. if you select Office 1, then the data for Offices 2 and 3 (the other group A offices) will also appear for context. Your formula correctly assigns rank 2 to Office 1 when Office 1 is selected, but does not show rank for Offices 2 or 3. Set analyses don't appear to make a difference here.
I've tried all three of:
aggr({<1>} rank(sum(Score)),Group,Office)
aggr(rank(sum({<1>} Score)),Group,Office)
aggr({<1>} rank(sum({<1>} Score)),Group,Office)
When I just use rank(sum({<1>} Score)) I am getting values to appear, so it seems to be something to do with AGGR even though I am specifying to ignore selections there. Any ideas?
- Mark as New
- Bookmark
- Subscribe
- Mute
- Subscribe to RSS Feed
- Permalink
- Report Inappropriate Content
Dear Omar,
Maybe you can help me on this.
It's some another from guys problem
So, I have this table
| Country | Regional | Sum |
| A | a1 | 123 |
| A | a2 | 140 |
| A | a3 | 141 |
| A | a4 | 144 |
| B | b1 | 110 |
| B | b2 | 2 |
| B | b3 | 5 |
| C | c1 | 20 |
| C | c2 | 114 |
And shoud show only the the list of countries and only 1 region sales in each country with first rank in this country.
it should look like this
| Country | Regional | Sum |
| A | a4 | 144 |
| B | b1 | 110 |
| C | c1 | 20 |
or
| Country | Sum |
| A | 144 |
| B | 110 |
| C | 20 |
I hope you can help on this. This principle is very useful, when you have a lot of regions, periods and sums and you should show only top of performance.
- Mark as New
- Bookmark
- Subscribe
- Mute
- Subscribe to RSS Feed
- Permalink
- Report Inappropriate Content
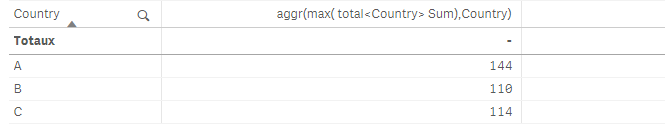
as dimension : country
as an expression : aggr(max( total<Country> Sum),Country)
result:
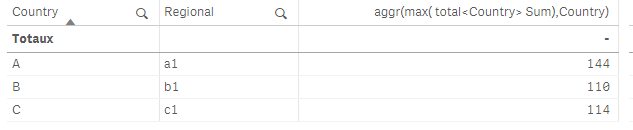
if you want to keep the regional dimension; use the same expression and in the add-on tab; uncheck show null values:
- Mark as New
- Bookmark
- Subscribe
- Mute
- Subscribe to RSS Feed
- Permalink
- Report Inappropriate Content
Hi,
if filter by Group='B' it doesn't work. Do you have a solution?
Thank you