Unlock a world of possibilities! Login now and discover the exclusive benefits awaiting you.
Announcements
Qlik and ServiceNow Partner to Bring Trusted Enterprise Context into AI-Powered Workflows. Learn More!
- Qlik Community
- :
- Forums
- :
- Analytics & AI
- :
- Products & Topics
- :
- Visualization and Usability
- :
- Re: How to display /sort year in a line graph
Options
- Subscribe to RSS Feed
- Mark Topic as New
- Mark Topic as Read
- Float this Topic for Current User
- Bookmark
- Subscribe
- Mute
- Printer Friendly Page
Turn on suggestions
Auto-suggest helps you quickly narrow down your search results by suggesting possible matches as you type.
Showing results for
Not applicable
2017-07-04
09:42 AM
- Mark as New
- Bookmark
- Subscribe
- Mute
- Subscribe to RSS Feed
- Permalink
- Report Inappropriate Content
Re: How to display /sort year in a line graph
Hi,
I have a data set that has financial information from 1980 to 2018 I only want to create a line graph showing the information from 2010 - 2018. how do i achieve this please assist.
Thank you
Regards
Saran
- Tags:
- saran
2,694 Views
- « Previous Replies
-
- 1
- 2
- Next Replies »
14 Replies
Not applicable
2017-07-05
03:28 AM
Author
- Mark as New
- Bookmark
- Subscribe
- Mute
- Subscribe to RSS Feed
- Permalink
- Report Inappropriate Content
Thank you its working now..
869 Views
Anonymous
Not applicable
2017-07-05
03:42 AM
Author
- Mark as New
- Bookmark
- Subscribe
- Mute
- Subscribe to RSS Feed
- Permalink
- Report Inappropriate Content
Partner - Creator III
2017-07-05
03:49 AM
- Mark as New
- Bookmark
- Subscribe
- Mute
- Subscribe to RSS Feed
- Permalink
- Report Inappropriate Content
What is the issue with this function you are facing??
869 Views
Anonymous
Not applicable
2017-07-05
03:56 AM
Author
- Mark as New
- Bookmark
- Subscribe
- Mute
- Subscribe to RSS Feed
- Permalink
- Report Inappropriate Content
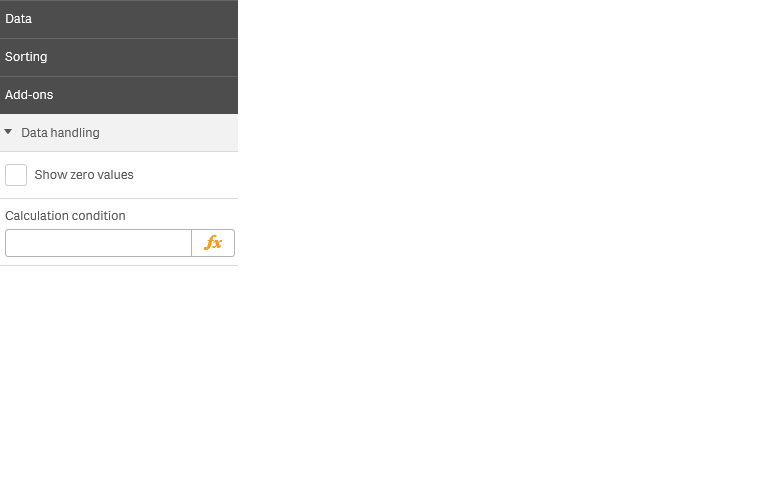
Hi
try to uncheck this.
Not applicable
2017-07-06
02:28 AM
Author
- Mark as New
- Bookmark
- Subscribe
- Mute
- Subscribe to RSS Feed
- Permalink
- Report Inappropriate Content
Hi I was able to make it work
thank you
869 Views
- « Previous Replies
-
- 1
- 2
- Next Replies »