Unlock a world of possibilities! Login now and discover the exclusive benefits awaiting you.

- Qlik Community
- :
- Forums
- :
- Analytics & AI
- :
- Products & Topics
- :
- Visualization and Usability
- :
- Re: Remove time stamp from line chart
- Subscribe to RSS Feed
- Mark Topic as New
- Mark Topic as Read
- Float this Topic for Current User
- Bookmark
- Subscribe
- Mute
- Printer Friendly Page

 tdclicksense
- Mark as New
- Bookmark
- Subscribe
- Mute
- Subscribe to RSS Feed
- Permalink
- Report Inappropriate Content
Remove time stamp from line chart
Hello,
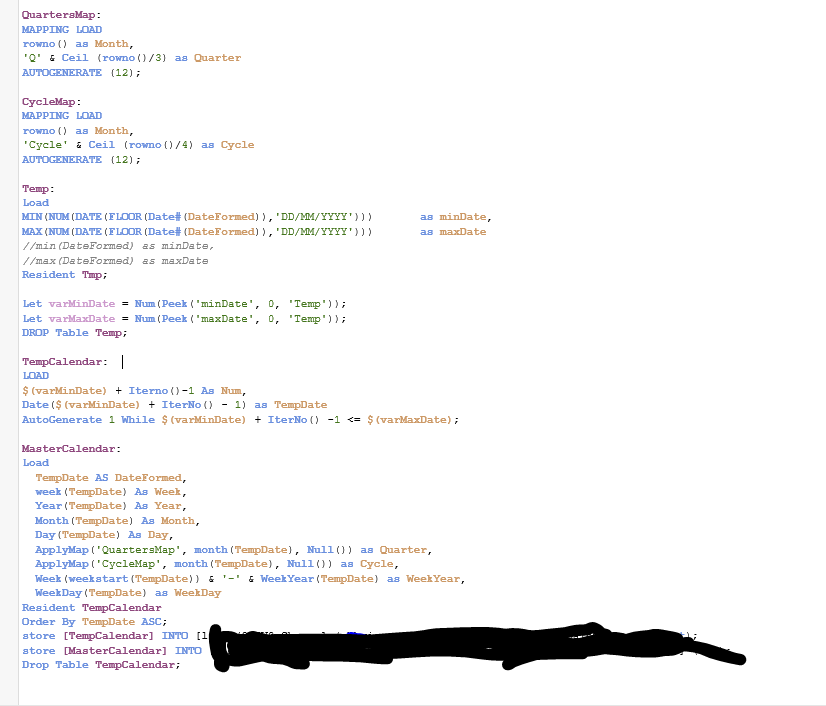
I have created a line chart. The purpose of this line chart is to show how many calls are made during a period(year, month or week). Wit a script from this forum I have created a master calender and use it as an dimension.
It is working as expected. However when I drill down from month to week I get next to the date of that week also timestamps(see screenshot below). I can not figure out why the timestamps are shown. They are not present in the excel files. Also in de the callender I have used Date format.
I have tried everything to solve this issue with no luck. Can pls someone help me with this issue.


 Lisa_P
- Mark as New
- Bookmark
- Subscribe
- Mute
- Subscribe to RSS Feed
- Permalink
- Report Inappropriate Content
Try turning off Continuous on your X-axis under properties
tdclicksense
- Mark as New
- Bookmark
- Subscribe
- Mute
- Subscribe to RSS Feed
- Permalink
- Report Inappropriate Content
Hi Lisa_P,
Thanks for your reply. I have turned off Continuous on my X-axis. The timestamps are still shown.
tdclicksense
- Mark as New
- Bookmark
- Subscribe
- Mute
- Subscribe to RSS Feed
- Permalink
- Report Inappropriate Content
All try outs are welcome.

 Tanalex
- Mark as New
- Bookmark
- Subscribe
- Mute
- Subscribe to RSS Feed
- Permalink
- Report Inappropriate Content
You can add this in your load script:
FLOOR(<field used in your x-axis>) AS <field alias>
This removes the time portion of the internal Qlik date.
tdclicksense
- Mark as New
- Bookmark
- Subscribe
- Mute
- Subscribe to RSS Feed
- Permalink
- Report Inappropriate Content
Hi Lisa_P,
I Only unchecked the Check box. But i also needed to set it on custom.
many thanks for your your time and of course the given solution.
 sachin1
- Mark as New
- Bookmark
- Subscribe
- Mute
- Subscribe to RSS Feed
- Permalink
- Report Inappropriate Content
What you did Can you explain:
