Unlock a world of possibilities! Login now and discover the exclusive benefits awaiting you.

- Qlik Community
- :
- Forums
- :
- Analytics & AI
- :
- Products & Topics
- :
- Visualization and Usability
- :
- Re: Rolling 12 months count
- Subscribe to RSS Feed
- Mark Topic as New
- Mark Topic as Read
- Float this Topic for Current User
- Bookmark
- Subscribe
- Mute
- Printer Friendly Page

 rammuthiah
- Mark as New
- Bookmark
- Subscribe
- Mute
- Subscribe to RSS Feed
- Permalink
- Report Inappropriate Content
Rolling 12 months count
In Graph, For ex month of today is August, then I need to show the project count from Next of current month(I mean from sep) to current month of Current year My output should be : Current Month (08/2018)
| ||||||||||||||||||||||||
Here below find the data :
| YearMonth | Projects |
| 1/2017 | 20 |
| 2/2017 | 30 |
| 3/2017 | 40 |
| 4/2017 | 50 |
| 5/2017 | 60 |
| 6/2017 | 20 |
| 7/2017 | 40 |
| 8/2017 | 50 |
| 9/2017 | 60 |
| 10/2017 | 20 |
| 11/2017 | 20 |
| 12/2017 | 30 |
| 1/2018 | 40 |
| 2/2018 | 50 |
| 3/2018 | 50 |
| 4/2018 | 60 |
| 5/2018 | 20 |
| 6/2018 | 40 |
| 7/2018 | 50 |
| 8/2018 | 50 |
| 9/2018 | 60 |
| 10/2018 | 20 |
| 11/2018 | 20 |
| 12/2018 | 30 |
| 1/2019 | 40 |
| 2/2019 | 50 |
| 3/2019 | 50 |
| 4/2019 | 60 |
Accepted Solutions

 OmarBenSalem
- Mark as New
- Bookmark
- Subscribe
- Mute
- Subscribe to RSS Feed
- Permalink
- Report Inappropriate Content
1) add a date field in ur table;:
load *, date(Date#('01'&'/'&YearMonth,'DD/M/YYYY')) as DateField Inline [
YearMonth, Projects
1/2017, 20
2/2017, 30
3/2017, 40
4/2017, 50
5/2017, 60
6/2017, 20
7/2017, 40
8/2017, 50
9/2017, 60
10/201,7 20
11/201,7 20
12/201,7 30
1/2018, 40
2/2018, 50
3/2018, 50
4/2018, 60
5/2018, 20
6/2018, 40
7/2018, 50
8/2018, 50
9/2018, 60
10/2018, 20
11/2018, 20
12/2018, 30
1/2019, 40
2/2019, 50
3/2019 ,50
4/2019, 60
];
2) use this expression:
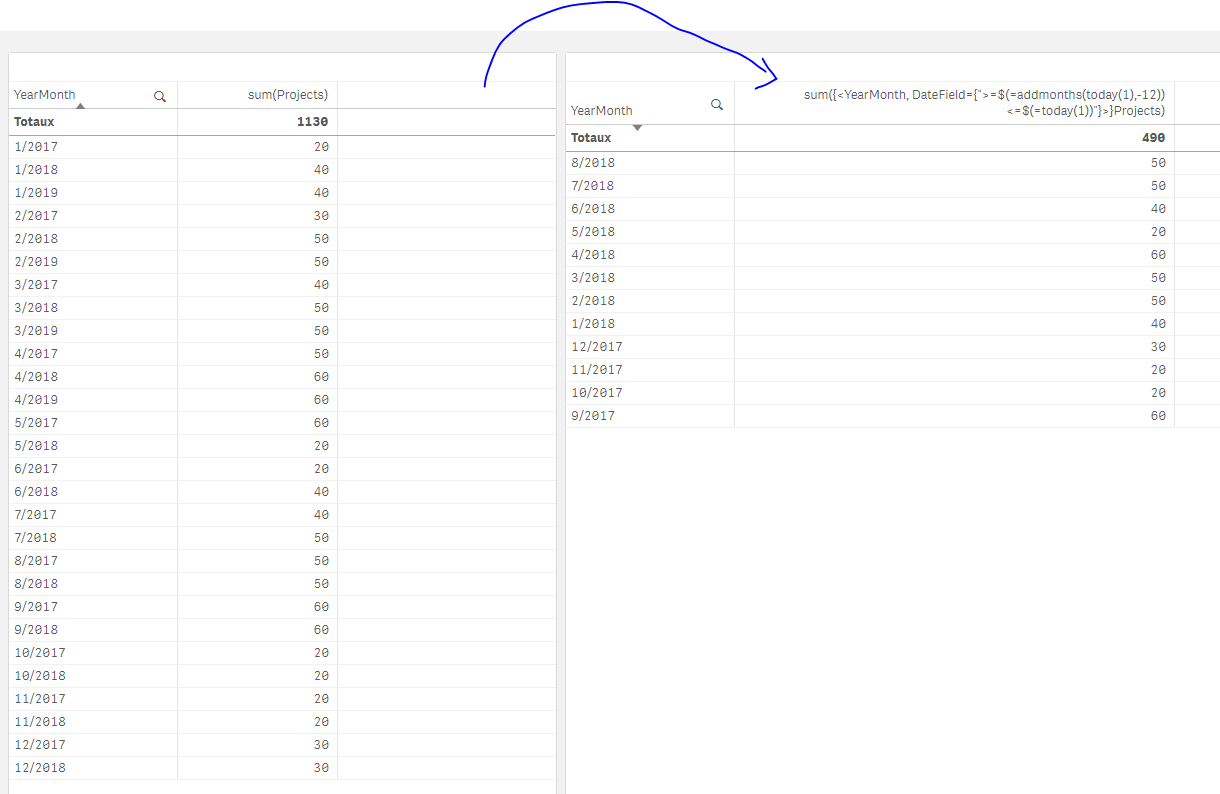
sum({<YearMonth, DateField={">=$(=addmonths(today(1),-12))<=$(=today(1))"}>}Projects)
Result:
OmarBenSalem
- Mark as New
- Bookmark
- Subscribe
- Mute
- Subscribe to RSS Feed
- Permalink
- Report Inappropriate Content
1) add a date field in ur table;:
load *, date(Date#('01'&'/'&YearMonth,'DD/M/YYYY')) as DateField Inline [
YearMonth, Projects
1/2017, 20
2/2017, 30
3/2017, 40
4/2017, 50
5/2017, 60
6/2017, 20
7/2017, 40
8/2017, 50
9/2017, 60
10/201,7 20
11/201,7 20
12/201,7 30
1/2018, 40
2/2018, 50
3/2018, 50
4/2018, 60
5/2018, 20
6/2018, 40
7/2018, 50
8/2018, 50
9/2018, 60
10/2018, 20
11/2018, 20
12/2018, 30
1/2019, 40
2/2019, 50
3/2019 ,50
4/2019, 60
];
2) use this expression:
sum({<YearMonth, DateField={">=$(=addmonths(today(1),-12))<=$(=today(1))"}>}Projects)
Result:
