Unlock a world of possibilities! Login now and discover the exclusive benefits awaiting you.
- Qlik Community
- :
- Forums
- :
- Analytics & AI
- :
- Products & Topics
- :
- Visualization and Usability
- :
- Rolling sum on Qlik Sense
- Subscribe to RSS Feed
- Mark Topic as New
- Mark Topic as Read
- Float this Topic for Current User
- Bookmark
- Subscribe
- Mute
- Printer Friendly Page
- Mark as New
- Bookmark
- Subscribe
- Mute
- Subscribe to RSS Feed
- Permalink
- Report Inappropriate Content
Rolling sum on Qlik Sense
Hi all,
I need to build a "rolling sum" plot (or table as well), i. e. a sum that month by month runs on the latest 12 months.
More precisely, I have a graph that shows a variable (the number of sold products) month by month.
The other variable I want to show is the sum of sold products on one year up to that month.
The result should be a plot showing (month by month) the units sold in that month (e.g. March 2017) and the units sold on one year that far (e.g. April 2016 - March 2017).
I hope the request is clear.
Any help would be very appreciated.
Thanks, LuigiZ
- Tags:
- rolling sum
- « Previous Replies
- Next Replies »
Accepted Solutions
- Mark as New
- Bookmark
- Subscribe
- Mute
- Subscribe to RSS Feed
- Permalink
- Report Inappropriate Content
Tank you agigliotti!
I've read that article, as it was advised earlier by omarbensalem, but couldn't transpose it in my case.
I did some try as well, but with no result.
The formula you suggest gives a total, but it's not the right one (it makes a sum but I don't understand the calculus).
So I tried to remove the outest "Sum( Aggr(" and it works fine (see attached file).
So the right formula, for my case, is:
RangeSum(
Above( total Sum( {<[PostingDate.autoCalendar.YearMonth] = >} Quantity)
, 0, 3)
)
This makes a 3 months Rolling sum.
By wrinting 12 instead of 3 I make 12 months rolling sum.
Great thank you to all who contributed.
- Mark as New
- Bookmark
- Subscribe
- Mute
- Subscribe to RSS Feed
- Permalink
- Report Inappropriate Content
Sum({<Num_Month = {$(=Max(Num_Month)-1)}, Year = {$(=Max(Year)-1)} >} Units_Sold)
Not a perfected expression cus by default what should be shown?
Current year sales or previous year sales?
And the selection should only happen if Month is selected?
if(getselectedcount(Month)>0,
Sum({<Num_Month = {$(=Max(Num_Month)-1)}, Year = {$(=Max(Year)-1)} >} Units_Sold))
Maybe this would work...? Num month should be a numeric field and year as well.
- Mark as New
- Bookmark
- Subscribe
- Mute
- Subscribe to RSS Feed
- Permalink
- Report Inappropriate Content
Hi Aehman,
the first formula you provided works but it gives the same result as:
Sum(Units_Sold)
What I wanted to do, instead, is to create sum of Units_Sold on the last 12 months, month by month (the so called Rolling sum).
Something like this:
Sum(FROM Date.autoCalendar.MonthsAgo = 12 TO Date.autoCalendar.YearMonth)
But I don't know how to set these two ends of the sum
Thanks
- Mark as New
- Bookmark
- Subscribe
- Mute
- Subscribe to RSS Feed
- Permalink
- Report Inappropriate Content
Hi Luugi,
check this: https://qlikviewandsql.wordpress.com/tag/cumulative-total/
i hope that helps
Beck
- Mark as New
- Bookmark
- Subscribe
- Mute
- Subscribe to RSS Feed
- Permalink
- Report Inappropriate Content
Thanks Beck,
I'm not able to get you proposal: my table has 1 record with Quantity and Date fields, so I have a number in quantity for each day.
I'm looking for a Measure expression to put in the plot.
Thanks again
- Mark as New
- Bookmark
- Subscribe
- Mute
- Subscribe to RSS Feed
- Permalink
- Report Inappropriate Content
Complete information.
I created a table in the same app showing the same result of the plot, but in numeric way (both have the same issue).
My plot have
DIMENSION = Date.Auttocalendar.YearMonth
MEASURE = Sum(Quantity)
and it correctly shows me the total number of items sold per each month.
I'm really not able to show the units sold over 1 year:
Oct 2017 to show units sold from Nov,1 2016 to Oct, 31 2017
Nov 2017 to show units sold from Dec, 1 2016 to Nov, 30 2017
Dec 2017 to show units sold from Jan, 1 2017 to Dec, 31 2017
My fields are DATE for the dates and QUANTITY for the number of units
- Mark as New
- Bookmark
- Subscribe
- Mute
- Subscribe to RSS Feed
- Permalink
- Report Inappropriate Content
I'm really not able to show the units sold over 1 year:
Oct 2017 to show units sold from Nov,1 2016 to Oct, 31 2017
Nov 2017 to show units sold from Dec, 1 2016 to Nov, 30 2017
Dec 2017 to show units sold from Jan, 1 2017 to Dec, 31 2017
You want to how previous year sales upon selection of a particular field or by default?
You can create a Last Year Flag in back end, use that Flag =1 in expression to show the sales of PYTD.
Maybe I'm wrong, this looks like rolling year with month
Can you post a sample data?
Thanks
- Mark as New
- Bookmark
- Subscribe
- Mute
- Subscribe to RSS Feed
- Permalink
- Report Inappropriate Content
Create your own master calendar: (it's always better to build ur own calendar, it's a preference thing)
Just copy and paste this:
Let vMinDate=num(MakeDate(2014,12,31));
//Let vMinDate= AddYears(today(),-2);
Let vMaxDate=Today()+30;
NoConcatenate
[D_Calendar_TMP]:
Load date($(vMinDate)+ RowNo()) as [Calendar date]
AutoGenerate $(vMaxDate)-$(vMinDate);
NoConcatenate
[D_Calendar_TMP2]:
Load RowNo() as [%Date SEQ]
,AutoNumber(date([Calendar date], 'DD/MM/YYYY'),'%Date ID') as [%Date ID]
,date([Calendar date], 'DD/MM/YYYY') as [Calendar date]
,Day([Calendar date]) as [Day of date]
,'W' & right(WeekName([Calendar date],0,-4), 2) as [week date]
,'Q' & Num(ceil(month([Calendar date])/3), '00') as [quarter date]
, right(WeekName([Calendar date],0,-4), 2) as [Week of date]
,Month([Calendar date]) as [Month of date]
,QuarterName([Calendar date]) as [Quarter of date]
,Year([Calendar date]) as [Year of date]
, right(WeekName([Calendar date],0,-4), 2) &'/'&Year([Calendar date]) as [Year week date]
,date(MonthStart([Calendar date]),'MMM YYYY') as [Year month date]
,num( Year([Calendar date]) ) & '- Q' & Num(ceil(month([Calendar date])/3), '00') as [Year quarter date]
,WeekStart([Calendar date],0,-4) as [Week start date]
,WeekEnd([Calendar date],0,-4) as [Week end date]
,MonthStart([Calendar date]) as [Month start date]
,MonthEnd([Calendar date]) as [Month end date]
,QuarterStart([Calendar date]) as [Quarter start date]
,QuarterEnd([Calendar date]) as [Quarter end date]
,YearStart([Calendar date]) as [Year start date]
,YearEnd([Calendar date]) as [Year end date]
,AutoNumber(WeekEnd([Calendar date],0,-4) , '%Year week SEQ') as [%Year week SEQ]
,AutoNumber(Num(Month([Calendar date]), '00')&'/'&Year([Calendar date]), '%Year month SEQ') as [%Year month SEQ]
,AutoNumber(Num(QuarterName([Calendar date]), '00')&'/'&Year([Calendar date]), '%Year quarter SEQ') as [%Year quarter SEQ]
,if(monthstart(date([Calendar date],'MM/YYYY'))= monthstart(date(Today() ,'MM/YYYY')) ,monthstart(date(AddMonths(Today(),-2),'MM/YYYY')), monthstart(date(AddMonths([Calendar date] ,-1),'MM/YYYY'))) as [Month Fact]
Resident D_Calendar_TMP;
join(D_Calendar_TMP2)
Load max([%Date ID]) as [%Date ID]
,1 as [Week end flag]
Resident D_Calendar_TMP2
Group by [Week end date];
join(D_Calendar_TMP2)
Load max([%Date ID]) as [%Date ID]
,1 as [Month end flag]
Resident D_Calendar_TMP2
Group by [Month end date];
join(D_Calendar_TMP2)
Load max([%Date ID]) as [%Date ID]
,1 as [Quarter end flag]
Resident D_Calendar_TMP2
Group by [Quarter end date];
join(D_Calendar_TMP2)
Load max([%Date ID]) as [%Date ID]
,1 as [Year end flag]
Resident D_Calendar_TMP2
Group by [Year end date];
join(D_Calendar_TMP2)
Load min([%Date ID]) as [%Date ID]
,1 as [Week start flag]
Resident D_Calendar_TMP2
Group by [Week start date];
join(D_Calendar_TMP2)
Load min([%Date ID]) as [%Date ID]
,1 as [Month start flag]
Resident D_Calendar_TMP2
Group by [Month start date];
join(D_Calendar_TMP2)
Load min([%Date ID]) as [%Date ID]
,1 as [Quarter start flag]
Resident D_Calendar_TMP2
Group by [Quarter start date];
join(D_Calendar_TMP2)
Load min([%Date ID]) as [%Date ID]
,1 as [Year start flag]
Resident D_Calendar_TMP2
Group by [Year start date];
NoConcatenate
D_Calendar:
Load [%Date SEQ]
,[%Date ID]
,[Calendar date]
,[Day of date]
,[Week of date]
,[Month of date]
,[Quarter of date]
,[Year of date]
,[Year week date]
,[Year month date]
,[week date]
,[quarter date]
,[Year quarter date]
,[Week start date]
,[Week end date]
,[Month start date]
,[Month end date]
,[Quarter start date]
,[Quarter end date]
,[Year start date]
,[Year end date]
,[%Year week SEQ]
,[%Year month SEQ]
,[%Year quarter SEQ]
,[Month Fact]
,Num ( (date([Calendar date],'DD/MM/YYYY') - date([Month start date],'DD/MM/YYYY')) + 1) AS [Month Diff]
,Num ( (date([Calendar date],'DD/MM/YYYY') - date([Quarter start date],'DD/MM/YYYY')) + 1) AS [Quarter Diff]
,Num ( (date([Calendar date],'DD/MM/YYYY') - date([Year start date],'DD/MM/YYYY')) + 1) AS [Year Diff]
,if(WeekEnd([Calendar date])=WeekEnd(Date(Today()-1,'DD/MM/YYYY')),Date(Today()-1,'DD/MM/YYYY'), WeekEnd([Calendar date])) as [Week end date 2]
,if(MonthEnd([Calendar date])=MonthEnd(Date(Today()-1,'DD/MM/YYYY')),date(Date(Today()-1,'DD/MM/YYYY'),'MMM YYYY'), date(MonthEnd([Calendar date]),'MMM YYYY') ) as [Month end date 2]
,if(QuarterEnd([Calendar date])=QuarterEnd(Date(Today()-1,'DD/MM/YYYY')),date(Date(Today()-1,'DD/MM/YYYY'),'MMM YYYY'), date(QuarterEnd([Calendar date]),'MMM YYYY') ) as [Quarter end date 2]
,if(YearEnd([Calendar date])=YearEnd(Date(Today()-1,'DD/MM/YYYY')),date(Date(Today()-1,'DD/MM/YYYY'),'MMM YYYY'), date(YearEnd([Calendar date]),'MMM YYYY') ) as [Year end date 2]
//,if([Calendar date]=Date(Today()-1,'DD/MM/YYYY'),1,[Week end flag]) as [Week end flag]
, if(date(floor( WeekEnd([Calendar date],0,-4)))=date(floor(WeekEnd(Today()-1,0,-4))),
if([Calendar date]=Date( '$(vCheckRevenuDate)','DD/MM/YYYY'),1),[Week end flag]) as [Week end flag]
,if(date(floor( MonthEnd([Calendar date])))=date(floor(MonthEnd(Date(Today()-1,'DD/MM/YYYY')))),
if([Calendar date]=Date( '$(vCheckRevenuDate)','DD/MM/YYYY'),1),[Month end flag]) as [Month end flag]
,if( date(floor(QuarterEnd([Calendar date])))=date(floor(QuarterEnd(Date(Today()-1,'DD/MM/YYYY')))),
if( [Calendar date]=Date('$(vCheckRevenuDate)','DD/MM/YYYY'),1) ,[Quarter end flag] ) as [Quarter end flag]
//,if([Calendar date]=Date(Today()-1,'DD/MM/YYYY'),1,[Year end flag]) as [Year end flag]
, if(date(floor( YearEnd([Calendar date])))=date(floor(YearEnd(Date(Today()-1,'DD/MM/YYYY')))),
if([Calendar date]=Date( '$(vCheckRevenuDate)','DD/MM/YYYY'),1),[Year end flag]) as [Year end flag]
, [Week start flag]
, [Month start flag]
, [Quarter start flag]
, [Year start flag]
// ,if(date(floor(MonthEnd([Calendar date])))=date(floor(MonthEnd(Date(Today()-1,'DD/MM/YYYY')))),
// if([Calendar date]=Date('$(vCheckRevenuDate)','DD/MM/YYYY'),1),[Month start flag] ) as [Month start flag]
,AutoNumber(Num(Month([Month Fact]), '00')&'/'&Year([Month Fact]), '%Year month fact SEQ') as [%Year month fact SEQ]
Resident D_Calendar_TMP2;
Drop table D_Calendar_TMP, D_Calendar_TMP2;
DONT't change a thing
Then, in your fact table, in which you have the date field; do as follow:
AutoNumber(date(YourDateField, 'DD/MM/YYYY'),'%Date ID') as [%Date ID]
Now: as an expression for ur rolling month:
use this:
sum({<[Calendar date]=,[Month of date]=, [Year of date]=, [%Year month SEQ] = {"> $(= max([%Year month SEQ]) - 12) <= $(=[%Year month SEQ])"}>}QUANTITY)
and a dimension use :
date([Month end date 2], 'MMM-YYYY')
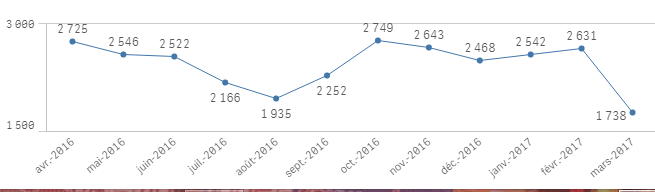
Now, when you choose a Mars 2017 for example, you'll have:
- Mark as New
- Bookmark
- Subscribe
- Mute
- Subscribe to RSS Feed
- Permalink
- Report Inappropriate Content
If you want cumulative rolling: please refer to this:
Calculating rolling n-period totals, averages or other aggregations
and try to use this:
sum( aggr( rangesum( above( sum(QUANTITY),0,12) ),Month))
- Mark as New
- Bookmark
- Subscribe
- Mute
- Subscribe to RSS Feed
- Permalink
- Report Inappropriate Content
Or try sthing like:
sum({<Date.Autocalendar.YearMonth=,Date.Autocalendar.Year=,Date.Autocalendar.Month=,Date.Autocalendar.Date=,
Date.Autocalendar.Month={">=$(=addMonths(max(Date.Autocalendar.Date),-12))<=$(=max(Date.Autocalendar.Date))"}>}Quantity)
- « Previous Replies
- Next Replies »