Unlock a world of possibilities! Login now and discover the exclusive benefits awaiting you.
- Qlik Community
- :
- Forums
- :
- Analytics & AI
- :
- Products & Topics
- :
- Visualization and Usability
- :
- Set Analysis - calcuating changes over time
- Subscribe to RSS Feed
- Mark Topic as New
- Mark Topic as Read
- Float this Topic for Current User
- Bookmark
- Subscribe
- Mute
- Printer Friendly Page
- Mark as New
- Bookmark
- Subscribe
- Mute
- Subscribe to RSS Feed
- Permalink
- Report Inappropriate Content
Set Analysis - calcuating changes over time
I have a request to show certain KPIs with monthly changes - imagine the KPI tool in Sense with the current value as the major component and the change as the minor component.
I wanted to try and keep this all in Qlik Sense, so what better way than to do it with Set Analysis! However my Set Analysis expression works, but not in the way I thought it would.
Taking some test data, I set up a "calendar" table that holds the current period, as well as the previous period so I can reference it in my set expressions:
Calendar:
load * inline
[
yrMonth, previousYrMonth
201601, 201512
201512, 201511
201511, 201510
];
monthdata:
load * inline
[
yrMonth, CategoryID, sales
201601, 1, 1600
201512, 1, 1500
201512, 2, 1500
201511, 1, 50
201511, 3, 100
];
So with this data, I have the following set expression:
Sum({$<yrMonth=P({1<yrMonth={$(=previousYrMonth)}>}yrMonth)>}sales)
Which I take as, where yrMonth equals the value in previous YrMonth, for those matching values in yrMonth based on the current selection of yrMonth take the sum of sales? This works only when I have a month selected as a filter, which is clearly not ideal!
Because alone, if I use that expression in something like a KPI with a month selected as a filter, it works fine ,(201601 selected)
(201601 selected)
| sum(Sales) | Sum({$<yrMonth=P({1<yrMonth={$(=previousYrMonth)}>}yrMonth)>}sales) |
|---|---|
| 1600 | 3000 |
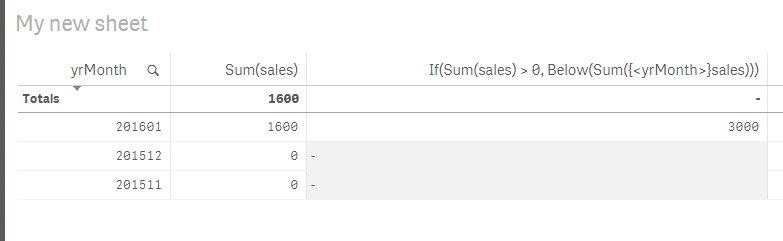
but if I include yrMonth itself as a dimension, I get the following:
| yrMonth | sum(Sales) | Sum({$<yrMonth=P({1<yrMonth={$(=previousYrMonth)}>}yrMonth)>}sales) |
|---|---|---|
| 201601 | 1600 | 0 |
| 201512 | 0 | 3000 |
| 201511 | 0 | 0 |
Clearly the expression is calculating the sum correctly, but on the previous month in the table (0 otherwise), hence summation on a single selected value works, but not ideal....
So my question is, can I get a formula like this working in this fashion, or should I just create it in the source data instead?
Accepted Solutions
- Mark as New
- Bookmark
- Subscribe
- Mute
- Subscribe to RSS Feed
- Permalink
- Report Inappropriate Content
You can try this, won't be affected by sorting anymore:
Aggr(If(Sum(sales) > 0, Below(Sum({<yrMonth>}sales))), (yrMonth, (NUMERIC, DESC)))
- Mark as New
- Bookmark
- Subscribe
- Mute
- Subscribe to RSS Feed
- Permalink
- Report Inappropriate Content
Try using Below() or Above() function based on the sorting you have instead of using Set analysis here. Try this:
If(Sum(sales) > 0, Below(Sum({<yrMonth>}sales)))
- Mark as New
- Bookmark
- Subscribe
- Mute
- Subscribe to RSS Feed
- Permalink
- Report Inappropriate Content
Hi,
You can write logic in QlikView Scripting instead of source data.
For more clarification on your issue, kindly share data.
Regards,
Kaushik Solanki
- Mark as New
- Bookmark
- Subscribe
- Mute
- Subscribe to RSS Feed
- Permalink
- Report Inappropriate Content
Interesting - I hadn't seen that before, but it looks like it is affected if you sort the data which I would like ot users to be able to do.
- Mark as New
- Bookmark
- Subscribe
- Mute
- Subscribe to RSS Feed
- Permalink
- Report Inappropriate Content
You can try this, won't be affected by sorting anymore:
Aggr(If(Sum(sales) > 0, Below(Sum({<yrMonth>}sales))), (yrMonth, (NUMERIC, DESC)))
- Mark as New
- Bookmark
- Subscribe
- Mute
- Subscribe to RSS Feed
- Permalink
- Report Inappropriate Content
That is definitely solving the problem! Thanks
- Mark as New
- Bookmark
- Subscribe
- Mute
- Subscribe to RSS Feed
- Permalink
- Report Inappropriate Content
Awesome 
The sorting in Aggr() is fairly recent introduction and you might find it interesting to read about it here: The sortable Aggr function is finally here!
- Mark as New
- Bookmark
- Subscribe
- Mute
- Subscribe to RSS Feed
- Permalink
- Report Inappropriate Content
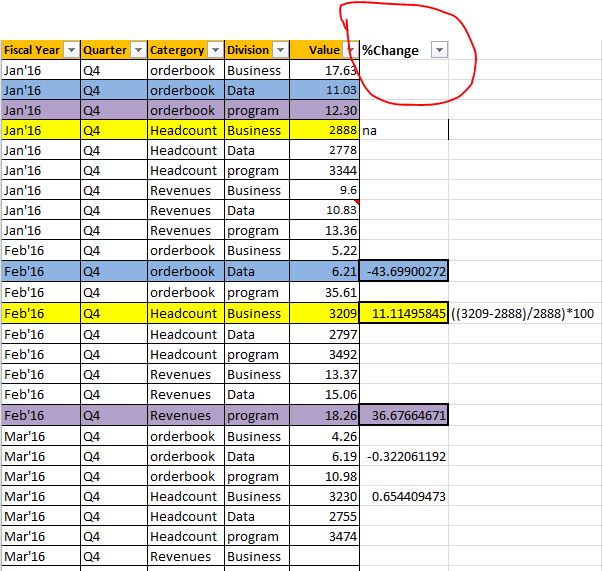
I have a similar requirement but just the 2 additional dimensions coming in, how to do it in this case?
- Mark as New
- Bookmark
- Subscribe
- Mute
- Subscribe to RSS Feed
- Permalink
- Report Inappropriate Content
So if you want to do it in the same way stalwar1 has suggested, you would use AGGR() and expand it to use all of your grouping columns - so in my case I just had "yrMonth", so you would have yrMonth/Category/Division.
If(Sum(value) > 0, Below(Sum({<yrMonth><Category><Division>}value)))
If you have a table where you want to allow sorting, you would have to do this (the marked answer)
Aggr(If(Sum(value) > 0, Below(Sumvalue))), (yrMonth, Category, Division, (NUMERIC, DESC))).
Note that you will need to have your date formatted differently, as the code above assumes the date field if sorted makes the dates appear in chronological order
However if you have a table where you only have one month selected at a time, and have setup a table with the current month and the previous month as columns, my formula works:
Sum({$<yrMonth=P({1<yrMonth={$(=previousYrMonth)}>}yrMonth)>}sales)