Unlock a world of possibilities! Login now and discover the exclusive benefits awaiting you.

- Qlik Community
- :
- Forums
- :
- Analytics & AI
- :
- Products & Topics
- :
- Visualization and Usability
- :
- Re: Show Month over Month Difference in Tooltip
- Subscribe to RSS Feed
- Mark Topic as New
- Mark Topic as Read
- Float this Topic for Current User
- Bookmark
- Subscribe
- Mute
- Printer Friendly Page

 qlikwiz123
- Mark as New
- Bookmark
- Subscribe
- Mute
- Subscribe to RSS Feed
- Permalink
- Report Inappropriate Content
Show Month over Month Difference in Tooltip
I have a Line Chart with Month-year as Dimension and Count(IDs) as Measure.
I would like to show Month over Month difference in the tool tip along with the count of IDs. How do I do that?
For example, if I hover over April 2023, the tooltip should show April Count(IDs) and difference in ID counts between March 2023 and April 2023
Accepted Solutions
 Prem0212
- Mark as New
- Bookmark
- Subscribe
- Mute
- Subscribe to RSS Feed
- Permalink
- Report Inappropriate Content
you can try this expression and its working for me
count({<Month>}distinct [Customer ID]) - Above(count({<Month>}distinct [Customer ID]), 1)
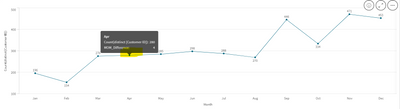
Please like and accept the solution if you liked it.

 Chanty4u
- Mark as New
- Bookmark
- Subscribe
- Mute
- Subscribe to RSS Feed
- Permalink
- Report Inappropriate Content
You can try on custom tooltip option below expression
RangeSum(Count(IDs) - Above(Count(IDs)),0)
Prem0212
- Mark as New
- Bookmark
- Subscribe
- Mute
- Subscribe to RSS Feed
- Permalink
- Report Inappropriate Content
you can try this expression and its working for me
count({<Month>}distinct [Customer ID]) - Above(count({<Month>}distinct [Customer ID]), 1)
Please like and accept the solution if you liked it.
qlikwiz123
- Mark as New
- Bookmark
- Subscribe
- Mute
- Subscribe to RSS Feed
- Permalink
- Report Inappropriate Content
What if I want to add Year over Year as a new tooltip? If a user points at March 2023, it should show difference between March 2022 and March 2023.
I tried substituting Month column with year but it is showing the same value as MoM
