Unlock a world of possibilities! Login now and discover the exclusive benefits awaiting you.

- Qlik Community
- :
- Forums
- :
- Analytics & AI
- :
- Products & Topics
- :
- Visualization and Usability
- :
- Slider Chart
- Subscribe to RSS Feed
- Mark Topic as New
- Mark Topic as Read
- Float this Topic for Current User
- Bookmark
- Subscribe
- Mute
- Printer Friendly Page

 desert_dweller
- Mark as New
- Bookmark
- Subscribe
- Mute
- Subscribe to RSS Feed
- Permalink
- Report Inappropriate Content
Slider Chart
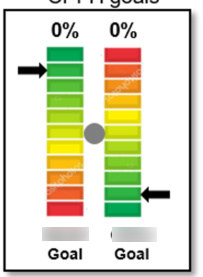
I have a requirement to create a chart that displays possible values for two measures for a dimension with the actual values indicated somehow. See the attached picture. Each bar represents possible values in a measure and the external arrows represent the dimensions value for each of the measures. Any tips on which chart type or extension I could start with to accomplish this?
Accepted Solutions

 OmarBenSalem
- Mark as New
- Bookmark
- Subscribe
- Mute
- Subscribe to RSS Feed
- Permalink
- Report Inappropriate Content
Maybe something like this?
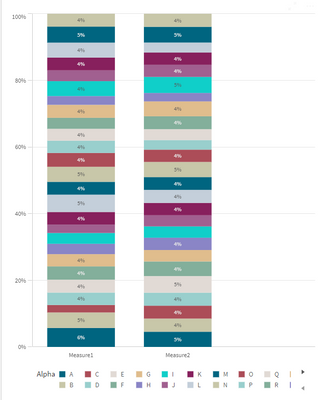
bar chart with 2 dimensions
Dim1=valuelist('Measure1','Measure2')
Dim2: the dimension you want to show
as a measure :
if(valuelist('Measure1','Measure2')='Measure1',sum(Expression1)/sum(total Expression1)
,sum(Expression2)/sum(total Expression2))
result:
OmarBenSalem
- Mark as New
- Bookmark
- Subscribe
- Mute
- Subscribe to RSS Feed
- Permalink
- Report Inappropriate Content
Maybe something like this?
bar chart with 2 dimensions
Dim1=valuelist('Measure1','Measure2')
Dim2: the dimension you want to show
as a measure :
if(valuelist('Measure1','Measure2')='Measure1',sum(Expression1)/sum(total Expression1)
,sum(Expression2)/sum(total Expression2))
result:
desert_dweller
- Mark as New
- Bookmark
- Subscribe
- Mute
- Subscribe to RSS Feed
- Permalink
- Report Inappropriate Content
Thank you, this is very close and will give me a good start. Thanks for pointing me in the right direction.
