Unlock a world of possibilities! Login now and discover the exclusive benefits awaiting you.
- Qlik Community
- :
- Forums
- :
- Analytics & AI
- :
- Products & Topics
- :
- Visualization and Usability
- :
- To display Positive and Negative Signs in KPI Obje...
- Subscribe to RSS Feed
- Mark Topic as New
- Mark Topic as Read
- Float this Topic for Current User
- Bookmark
- Subscribe
- Mute
- Printer Friendly Page
- Mark as New
- Bookmark
- Subscribe
- Mute
- Subscribe to RSS Feed
- Permalink
- Report Inappropriate Content
To display Positive and Negative Signs in KPI Object
Hi All,
I have requirement as below.
To populate positive and negative values like +1.1% or -2.5% and apply the colour Green for Positive values and Red for negative values using KPI Object in qlik Sense
The meaure I have used.
Num(Num($(Field1%)-$(Field2),'#,##0.0%'),'+#,##0.0%')
By appying the above I can the acheive the result but I am unable to display the '+' & '-' sign.
I have then Used Num(Num($(Field1%)-$(Field2),'#,##0.0%'),'+#,##0.0%') & Chr(10),By using this I can display the display the '+' & '-' but I am unable to Set the colours under Colour Tab.
The message shows "There is some error in the expression".
Is there any alternate to acheive this??
Thanks
SK
Accepted Solutions
- Mark as New
- Bookmark
- Subscribe
- Mute
- Subscribe to RSS Feed
- Permalink
- Report Inappropriate Content
Hi,
KPI objects allow you to set colours and formats in the properties.
Select Custom format and type:
+#,##0.0%;-#,##0.0%
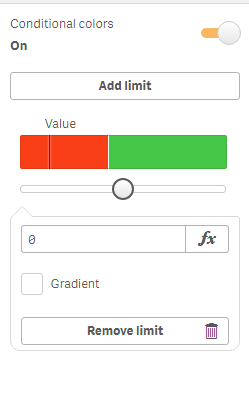
Then go to Appearance, turn Conditional Colours On and add a limit, type 0, click on the left colour and select Red, then click on the right colour and select Green. It should be something like this:
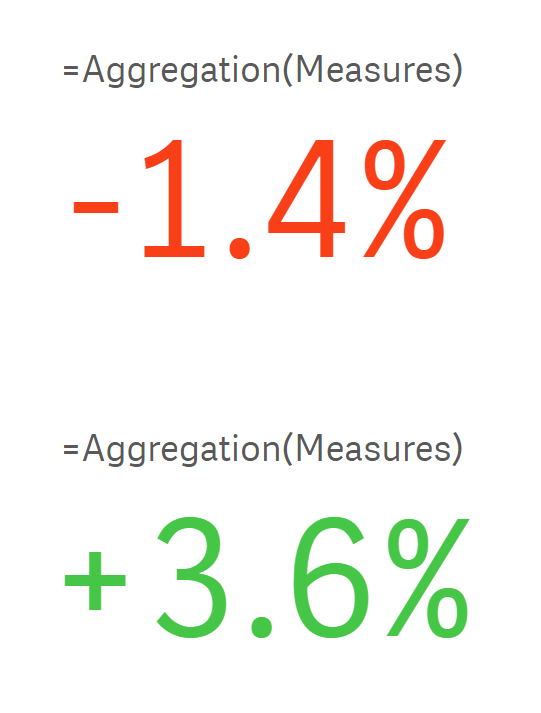
Your KPIs should look like this for example:
Instead of Selecting Custom formatting and specifying the format I've shown before you could've also set the format to Auto and have num with something like this:
=Num(aggregation(calculations),'+#,##0.0%;-#,##0.0%')
KPI Objects don't have the Background and Foreground colour expressions that other objects have, a table for example, in which you could've done this:
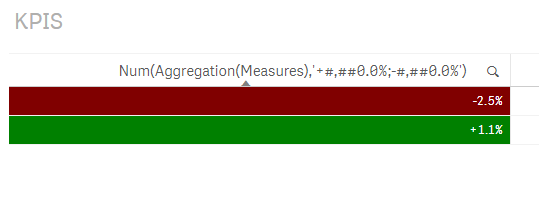
In which I've set the colour in the background to something like:
=If(aggregation(calculations)>=0,Green(),Red())
I hope his helps,
Cheers,
Luis
- Mark as New
- Bookmark
- Subscribe
- Mute
- Subscribe to RSS Feed
- Permalink
- Report Inappropriate Content
Hi,
can you attach sample working file.
Thanks,
Mukram
- Mark as New
- Bookmark
- Subscribe
- Mute
- Subscribe to RSS Feed
- Permalink
- Report Inappropriate Content
Hi,
Have you tried like this?
if(Num(Num($(Field1%)-$(Field2),'#,##0.0%'),'+#,##0.0%') & Chr(10) >0, Green(),red())
also u can try to use this simple table KPI extension.
Thanks,
Deva
- Mark as New
- Bookmark
- Subscribe
- Mute
- Subscribe to RSS Feed
- Permalink
- Report Inappropriate Content
Hi,
KPI objects allow you to set colours and formats in the properties.
Select Custom format and type:
+#,##0.0%;-#,##0.0%
Then go to Appearance, turn Conditional Colours On and add a limit, type 0, click on the left colour and select Red, then click on the right colour and select Green. It should be something like this:
Your KPIs should look like this for example:
Instead of Selecting Custom formatting and specifying the format I've shown before you could've also set the format to Auto and have num with something like this:
=Num(aggregation(calculations),'+#,##0.0%;-#,##0.0%')
KPI Objects don't have the Background and Foreground colour expressions that other objects have, a table for example, in which you could've done this:
In which I've set the colour in the background to something like:
=If(aggregation(calculations)>=0,Green(),Red())
I hope his helps,
Cheers,
Luis
- Mark as New
- Bookmark
- Subscribe
- Mute
- Subscribe to RSS Feed
- Permalink
- Report Inappropriate Content
Great response.
- Mark as New
- Bookmark
- Subscribe
- Mute
- Subscribe to RSS Feed
- Permalink
- Report Inappropriate Content
Hi Luis,
Excellent explanation.
Thanks,
S K