Unlock a world of possibilities! Login now and discover the exclusive benefits awaiting you.

- Qlik Community
- :
- Forums
- :
- Analytics & AI
- :
- Products & Topics
- :
- Visualization and Usability
- :
- Re: To show top 5 values
- Subscribe to RSS Feed
- Mark Topic as New
- Mark Topic as Read
- Float this Topic for Current User
- Bookmark
- Subscribe
- Mute
- Printer Friendly Page

 MK9885
- Mark as New
- Bookmark
- Subscribe
- Mute
- Subscribe to RSS Feed
- Permalink
- Report Inappropriate Content
To show top 5 values
I'm trying to show only top 5 values in a bar graph in Qlik Sense. I'm aware of Rank function but not able to achieve it.
I've this as dimension, =If([Field1] = 'Value' and Field2 <> 'Value, Field2)
I want to show top 5 based on the above expression.
- Tags:
- sorting
Accepted Solutions

 prashanth1712
- Mark as New
- Bookmark
- Subscribe
- Mute
- Subscribe to RSS Feed
- Permalink
- Report Inappropriate Content
Hi arvind,
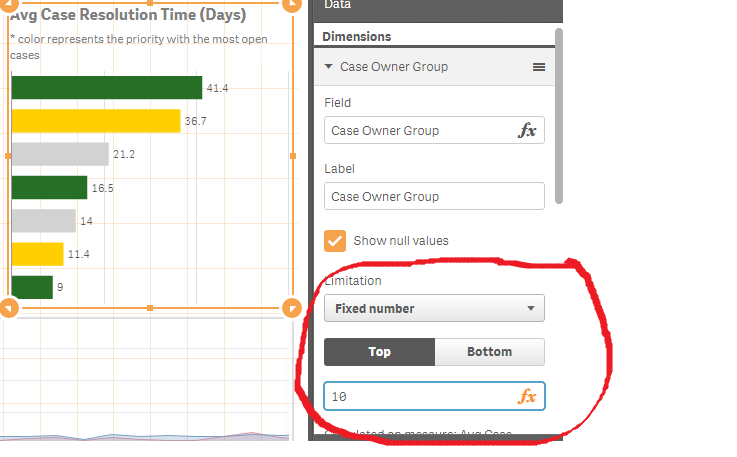
U will be having direct option to achieve that.
Just click on the dimension-> Limitation-> fixed number and enter 5 in the box

 sunny_talwar
- Mark as New
- Bookmark
- Subscribe
- Mute
- Subscribe to RSS Feed
- Permalink
- Report Inappropriate Content
What you have provided is the expression or is this a dimension? I am confused, can you elaborate?
MK9885
- Mark as New
- Bookmark
- Subscribe
- Mute
- Subscribe to RSS Feed
- Permalink
- Report Inappropriate Content
It's a Calculated Dimension
prashanth1712
- Mark as New
- Bookmark
- Subscribe
- Mute
- Subscribe to RSS Feed
- Permalink
- Report Inappropriate Content
Hi arvind,
U will be having direct option to achieve that.
Just click on the dimension-> Limitation-> fixed number and enter 5 in the box

- Mark as New
- Bookmark
- Subscribe
- Mute
- Subscribe to RSS Feed
- Permalink
- Report Inappropriate Content
Have you tried using the limitation function on the properties panel?
MK9885
- Mark as New
- Bookmark
- Subscribe
- Mute
- Subscribe to RSS Feed
- Permalink
- Report Inappropriate Content
Thanks Prashanth,
I was actually using an extension for Bar Graph and that is why I couldn't see the sorting option. Now I used the default Qlik Sense chart and I got it as you showed.
MK9885
- Mark as New
- Bookmark
- Subscribe
- Mute
- Subscribe to RSS Feed
- Permalink
- Report Inappropriate Content
Yes, I did now and I got it.
Thanks.