Unlock a world of possibilities! Login now and discover the exclusive benefits awaiting you.

- Qlik Community
- :
- Forums
- :
- Analytics & AI
- :
- Products & Topics
- :
- Visualization and Usability
- :
- Re: Top 80 bottom 20
- Subscribe to RSS Feed
- Mark Topic as New
- Mark Topic as Read
- Float this Topic for Current User
- Bookmark
- Subscribe
- Mute
- Printer Friendly Page

 yink-hpv
- Mark as New
- Bookmark
- Subscribe
- Mute
- Subscribe to RSS Feed
- Permalink
- Report Inappropriate Content
Top 80 bottom 20
Hi All: I'm fairly new to Qlik Sense, i have a question of calculate top 80 bottom 20 sales for each of ID.
ID Vendor Sales is raw data, i have manually calculated the result on column top80/bottom20
any one can help me set up set analysis in Qlik Sense or loading script to achieve this?
although i have sorted data by ID and Sales amount, the original isn't in a sorted order.
@Sunny Talwar i have read your post before, and use you QVF file for reference.
| ID | Vendor | Sales | % of sum by ID | Top80 /Bottom 20 |
| C | H | 600 | 4% | Bottom 20% |
| C | C | 900 | 6% | Bottom 20% |
| C | G | 1200 | 8% | Bottom 20% |
| C | A | 1300 | 9% | Top 80% |
| C | D | 1500 | 10% | Top 80% |
| C | E | 1500 | 10% | Top 80% |
| C | B | 2000 | 13% | Top 80% |
| C | C | 2500 | 17% | Top 80% |
| C | F | 3500 | 23% | Top 80% |
| N | A | 300 | 2% | Bottom 20% |
| N | H | 900 | 7% | Bottom 20% |
| N | E | 1100 | 9% | Bottom 20% |
| N | A | 1400 | 11% | Top 80% |
| N | G | 1400 | 11% | Top 80% |
| N | B | 2100 | 17% | Top 80% |
| N | B | 2200 | 17% | Top 80% |
| N | D | 3200 | 25% | Top 80% |

 brunobertels
- Mark as New
- Bookmark
- Subscribe
- Mute
- Subscribe to RSS Feed
- Permalink
- Report Inappropriate Content

 OmarBenSalem
- Mark as New
- Bookmark
- Subscribe
- Mute
- Subscribe to RSS Feed
- Permalink
- Report Inappropriate Content
is this correct?
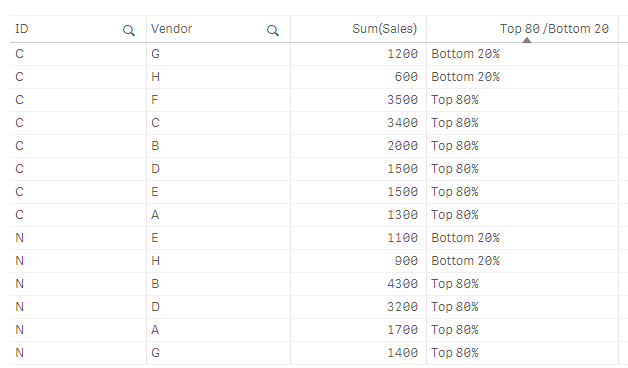
the measure used :
if(subfield(rank(sum({1}Sales),Type),'-')<(max(total <Type> aggr(rank({1}sum(Sales),Type),Type,Vendor)) * 0.8) ,'Top 80%','Bottom 20%')
see the attached app
yink-hpv
- Mark as New
- Bookmark
- Subscribe
- Mute
- Subscribe to RSS Feed
- Permalink
- Report Inappropriate Content
thanks for sharing Omar, it looks result incorrectly, they all bottom 20% after apply set analysis
OmarBenSalem
- Mark as New
- Bookmark
- Subscribe
- Mute
- Subscribe to RSS Feed
- Permalink
- Report Inappropriate Content
Can you share your expression?
If it works once; we should be able to make it work with a different set expression 
yink-hpv
- Mark as New
- Bookmark
- Subscribe
- Mute
- Subscribe to RSS Feed
- Permalink
- Report Inappropriate Content
i haven't work it out yet, it looks like a difficult for me
