Unlock a world of possibilities! Login now and discover the exclusive benefits awaiting you.

- Qlik Community
- :
- Forums
- :
- Analytics & AI
- :
- Products & Topics
- :
- Visualization and Usability
- :
- Vizlib Pivot hiding columns
- Subscribe to RSS Feed
- Mark Topic as New
- Mark Topic as Read
- Float this Topic for Current User
- Bookmark
- Subscribe
- Mute
- Printer Friendly Page

 Der_Unbekante_2
- Mark as New
- Bookmark
- Subscribe
- Mute
- Subscribe to RSS Feed
- Permalink
- Report Inappropriate Content
Vizlib Pivot hiding columns
Hello everyone,
currently I'm working on a Dashboard via Qlik Sense and created a vizlib pivot table.
What I try or want to do:
1.) I want to display only the three relevant certification types (DIN EN 15085, AS9100C, IRIS) and not all 100 certificates. I want to hide the other certifications.
I tried to sort the relevant certificates, so that I can see them at the first row (seems to work not right):
=match(CERTIFICATION_NAME, 'IRIS', 'DIN EN 15085', 'AS9100C', 0)
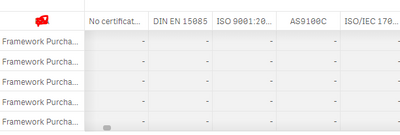
2.) I want to make the expiry date like the traffic light systems with green (Expiry date is still valid), orange (expires soon), red (is already expired) color --> See the screenshot. Where the '-' is standing is the date.
I would be happy to receive any help. I already searched on youtube, google and here in the forum for some solutions without any success.
Thanks in advance and Best wishes

 NitinK7
- Mark as New
- Bookmark
- Subscribe
- Mute
- Subscribe to RSS Feed
- Permalink
- Report Inappropriate Content
for the first point may be try below
pick(match(CERTIFICATION_NAME, 'IRIS', 'DIN EN 15085', 'AS9100C'),'IRIS', 'DIN EN 15085', 'AS9100C')
second point I can't understood clearly
