Unlock a world of possibilities! Login now and discover the exclusive benefits awaiting you.

- Qlik Community
- :
- Forums
- :
- Analytics & AI
- :
- Products & Topics
- :
- Visualization and Usability
- :
- alternate state and comparative chart
- Subscribe to RSS Feed
- Mark Topic as New
- Mark Topic as Read
- Float this Topic for Current User
- Bookmark
- Subscribe
- Mute
- Printer Friendly Page

 employe4_2
- Mark as New
- Bookmark
- Subscribe
- Mute
- Subscribe to RSS Feed
- Permalink
- Report Inappropriate Content
alternate state and comparative chart
Hi,
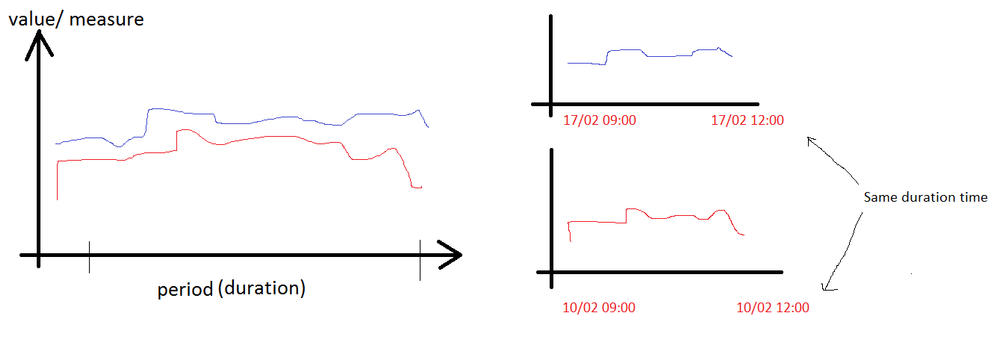
i want to build a line chart and compare a single measure from two different period of time (same lenght, not making it harder)
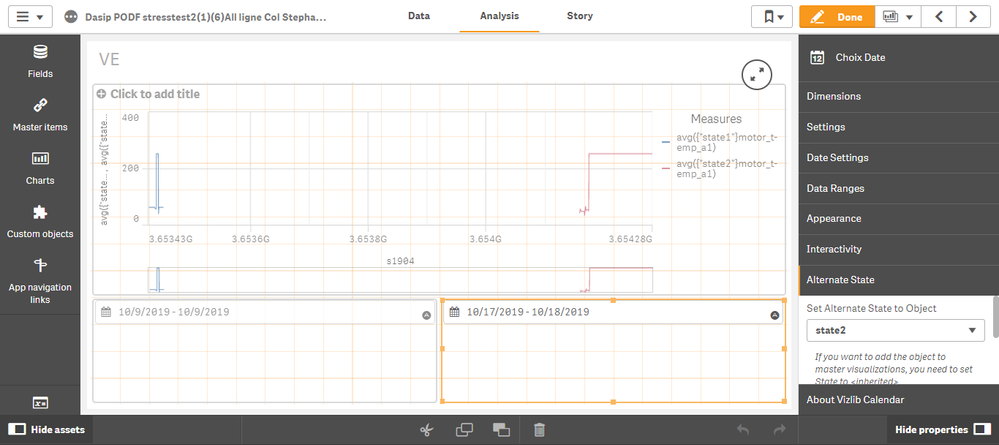
i tried with alternate sate,: i put my two measures define with state 1 and state2 in my single line chart
i define two calendar with the first one for state 1 and second one for state2, to define two period of time . but but since my chart is define with 'time' as dimension. Both of the measure play on the same chart, yes! but next to each other. i want to make them stack, one on the other. i'd like to get as dimension the first date/minute of {"state1"}[measureA] being aligned with the first date/minute of {"state2"}[measureA].
So i thought about defining my dimension in my chart as a duration and not a time: but hey i don't succeed that part: how could i define a dimensions that roughly says :DimensionsDuration" the first minute of my measure A selected in the first range of date, is the same first minute of measure A selected in that second range of date"for every minutes selected
and create a common dimension for "time periode"
I'm sorry for the bad English, and the weird question. Pretty hard to make the question clear.
Hope someone get it
Thanks Anyway !
employe4_2
- Mark as New
- Bookmark
- Subscribe
- Mute
- Subscribe to RSS Feed
- Permalink
- Report Inappropriate Content
My thoughts to the moment:
i must create that
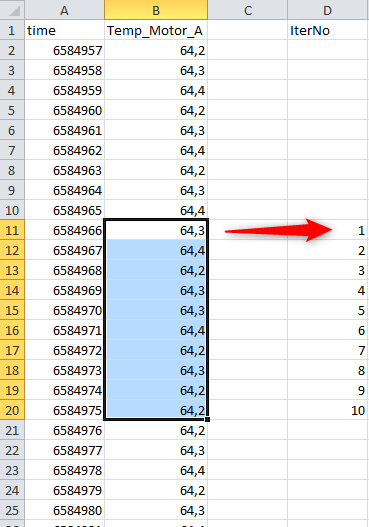
the goal is to make the data in IterNo dinamic. Whenever the selection is change we redo the numeric sequence next to the selected value.

 sunny_talwar
- Mark as New
- Bookmark
- Subscribe
- Mute
- Subscribe to RSS Feed
- Permalink
- Report Inappropriate Content
May be use The As-Of Table
