Unlock a world of possibilities! Login now and discover the exclusive benefits awaiting you.
- Qlik Community
- :
- Forums
- :
- Analytics & AI
- :
- Products & Topics
- :
- Visualization and Usability
- :
- Re: bar chart showing 6 decimal
- Subscribe to RSS Feed
- Mark Topic as New
- Mark Topic as Read
- Float this Topic for Current User
- Bookmark
- Subscribe
- Mute
- Printer Friendly Page
- Mark as New
- Bookmark
- Subscribe
- Mute
- Subscribe to RSS Feed
- Permalink
- Report Inappropriate Content
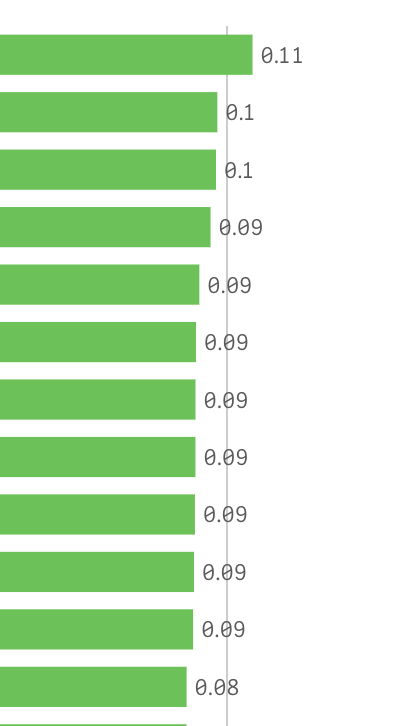
bar chart showing 6 decimal
Hi,
I am creating bar chart, the underline data has 7 decimal
but on the bar I can only see 1 or 2 decimal how could I change that and also my underline data is decimal could I change it into % and show in the bar chart
please use the first sheet
thank you!
Accepted Solutions
- Mark as New
- Bookmark
- Subscribe
- Mute
- Subscribe to RSS Feed
- Permalink
- Report Inappropriate Content
Soory I down load the app. but I could not open it.
I am using qlik sense online version: https://eu.qlikcloud.com
I was trying to load the qvw file but seems not work
- Mark as New
- Bookmark
- Subscribe
- Mute
- Subscribe to RSS Feed
- Permalink
- Report Inappropriate Content
Is this what you're looking for? (See attached)
>>Benazir
- Mark as New
- Bookmark
- Subscribe
- Mute
- Subscribe to RSS Feed
- Permalink
- Report Inappropriate Content
sorry did not see the attachment. could you please attache it again?
thank you!
- Mark as New
- Bookmark
- Subscribe
- Mute
- Subscribe to RSS Feed
- Permalink
- Report Inappropriate Content
Soory I down load the app. but I could not open it.
I am using qlik sense online version: https://eu.qlikcloud.com
I was trying to load the qvw file but seems not work
- Mark as New
- Bookmark
- Subscribe
- Mute
- Subscribe to RSS Feed
- Permalink
- Report Inappropriate Content
I'm sorry I just realized this was a sense discussion. Hold on - will share an appropriate file.
- Mark as New
- Bookmark
- Subscribe
- Mute
- Subscribe to RSS Feed
- Permalink
- Report Inappropriate Content
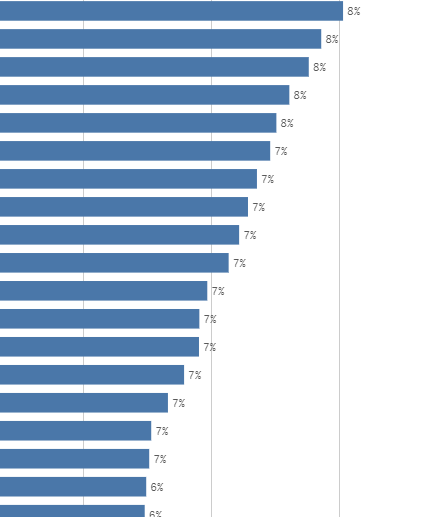
Once you've created the chart - go to number formatting on the Measure - Use Custom and put 0%

Does this solve it for you?
Rgds,
Benazir
- Mark as New
- Bookmark
- Subscribe
- Mute
- Subscribe to RSS Feed
- Permalink
- Report Inappropriate Content
Hi Benazir,
thank you'! the formatting part works
but how can I increase the digital say
I can only see
0.7. but the acture number is 0.683452, I hope to this at list 68.35% or 0.6835 in the graph
could you help me with this?
Thank you!
- Mark as New
- Bookmark
- Subscribe
- Mute
- Subscribe to RSS Feed
- Permalink
- Report Inappropriate Content
Hi
Try changing 0% in Format Pattern to 0.00%
Thanks,
RT