Unlock a world of possibilities! Login now and discover the exclusive benefits awaiting you.
- Qlik Community
- :
- Forums
- :
- Analytics & AI
- :
- Products & Topics
- :
- Visualization and Usability
- :
- Re: change the timescale in a bar chart dynamicall...
- Subscribe to RSS Feed
- Mark Topic as New
- Mark Topic as Read
- Float this Topic for Current User
- Bookmark
- Subscribe
- Mute
- Printer Friendly Page
- Mark as New
- Bookmark
- Subscribe
- Mute
- Subscribe to RSS Feed
- Permalink
- Report Inappropriate Content
change the timescale in a bar chart dynamically
Hi Together,
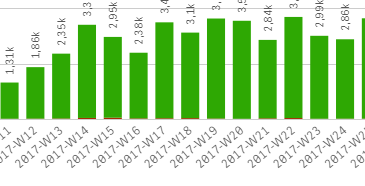
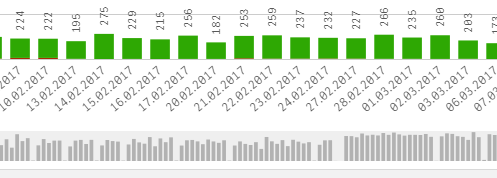
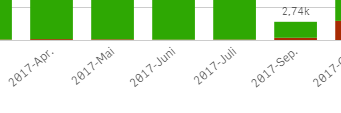
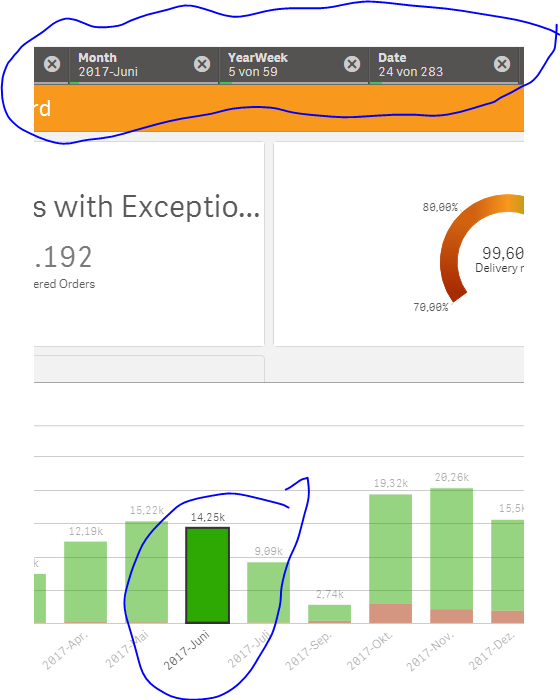
I have the following Problem: I need to change the timescale in my bar chart dynamically. In one case I need Days displayed in another week or month. I found a solution for that (by using pick match) but if i select a date or range it automaticly set the filter for week, month and day (the picture). What I want is, that only the date filter is shown.
Thanks
Mathias
- Mark as New
- Bookmark
- Subscribe
- Mute
- Subscribe to RSS Feed
- Permalink
- Report Inappropriate Content
You can't conrol that..
- Mark as New
- Bookmark
- Subscribe
- Mute
- Subscribe to RSS Feed
- Permalink
- Report Inappropriate Content
uiii,,,,,thanks
- Mark as New
- Bookmark
- Subscribe
- Mute
- Subscribe to RSS Feed
- Permalink
- Report Inappropriate Content
ccan you use time aware charts that will enable dynamic ranges based on the current selection?
- Mark as New
- Bookmark
- Subscribe
- Mute
- Subscribe to RSS Feed
- Permalink
- Report Inappropriate Content
Hi,
what about drill-down dimension?
- Mark as New
- Bookmark
- Subscribe
- Mute
- Subscribe to RSS Feed
- Permalink
- Report Inappropriate Content
Could work better. Im trying it 🙂 Thank you
- Mark as New
- Bookmark
- Subscribe
- Mute
- Subscribe to RSS Feed
- Permalink
- Report Inappropriate Content
Can you post the pick match expression here?
- Mark as New
- Bookmark
- Subscribe
- Mute
- Subscribe to RSS Feed
- Permalink
- Report Inappropriate Content
pick( PeriodDrill_ID,
Year,
Month,
$WeekYear,
Date
)
PeriodDrill is defined in Load Script:
PeriodTypes:
LOAD * INLINE [
TimeScale; PeriodDrill_ID;DateFormat
Years-Qu.;
Months; 2
Weeks; 3
Days; 4
] (delimiter is ';')
;