Unlock a world of possibilities! Login now and discover the exclusive benefits awaiting you.
- Qlik Community
- :
- Forums
- :
- Analytics & AI
- :
- Products & Topics
- :
- Visualization and Usability
- :
- changing line chart measure to display in percenta...
- Subscribe to RSS Feed
- Mark Topic as New
- Mark Topic as Read
- Float this Topic for Current User
- Bookmark
- Subscribe
- Mute
- Printer Friendly Page
- Mark as New
- Bookmark
- Subscribe
- Mute
- Subscribe to RSS Feed
- Permalink
- Report Inappropriate Content
changing line chart measure to display in percentage, with 100% the highest
I am farely new to qlik sense, I have using a line chart. I usually display data formerly on excel, would want the Y-axis to display in percentage(with 100% being the highest) and the X-axis showing the month and trend as the line moves. i.e in some months the the selected item wouldn't reach a 100% and in other it reaches.
- Mark as New
- Bookmark
- Subscribe
- Mute
- Subscribe to RSS Feed
- Permalink
- Report Inappropriate Content
What is your chart dimension and what are your chart expressions?
- Mark as New
- Bookmark
- Subscribe
- Mute
- Subscribe to RSS Feed
- Permalink
- Report Inappropriate Content
Hi Sunny,
The Dimension is based on months(a field) of the year while my measure is based on counts of a VALUE, but I put this in the measure(Num(sum([TICKET_ID_])/sum([TICKET_ID_]),'#,##0%') function box and everything becomes just a 100%.
- Mark as New
- Bookmark
- Subscribe
- Mute
- Subscribe to RSS Feed
- Permalink
- Report Inappropriate Content
e.g If I have 50 Items for the month and 40 meets my condition that I set, I want the measure(line graph) displaying 80% of the condition met. Is it possible ??
- Mark as New
- Bookmark
- Subscribe
- Mute
- Subscribe to RSS Feed
- Permalink
- Report Inappropriate Content
May be this:
Num(Sum([TICKET_ID_])/Sum(TOTAL [TICKET_ID_]),'#,##0%')
- Mark as New
- Bookmark
- Subscribe
- Mute
- Subscribe to RSS Feed
- Permalink
- Report Inappropriate Content
Hi Sunny.
that code starts the percentile with -100, I want starting from % to 100%.
- Mark as New
- Bookmark
- Subscribe
- Mute
- Subscribe to RSS Feed
- Permalink
- Report Inappropriate Content
Would you be able to share a sample to look at this?
- Mark as New
- Bookmark
- Subscribe
- Mute
- Subscribe to RSS Feed
- Permalink
- Report Inappropriate Content
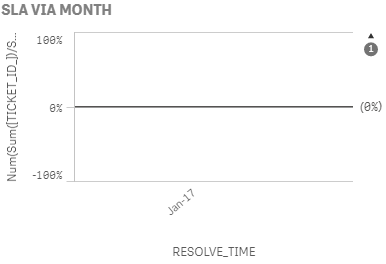
Hi sunny,
that's an image of it, I want the Y-axis starting from 0% and 100% being the highest. e.g If I have 50 Items for the month and 40 meets my condition that I set, I want the measure(line graph) displaying 80% of the condition met. Is it possible ??