Unlock a world of possibilities! Login now and discover the exclusive benefits awaiting you.

- Qlik Community
- :
- Forums
- :
- Analytics & AI
- :
- Products & Topics
- :
- Visualization and Usability
- :
- create Value range summary
Options
- Subscribe to RSS Feed
- Mark Topic as New
- Mark Topic as Read
- Float this Topic for Current User
- Bookmark
- Subscribe
- Mute
- Printer Friendly Page
Turn on suggestions
Auto-suggest helps you quickly narrow down your search results by suggesting possible matches as you type.
Showing results for

 linhnguyen
Contributor II
2020-05-07
11:53 AM
- Mark as New
- Bookmark
- Subscribe
- Mute
- Subscribe to RSS Feed
- Permalink
- Report Inappropriate Content
create Value range summary
Hello,
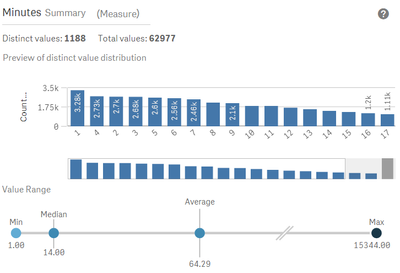
I am trying to create a value range as the chart at the bottom. I look at the current chart and extension collection, but it seems that there is nothing available. Can anybody let me know if I can create the bottom chart? I created a box plot, but its indicators (median, mean) are not identical.
the measure used in this chart is the time taken to complete a task. Minutes=(endeddate)-(starteddate)
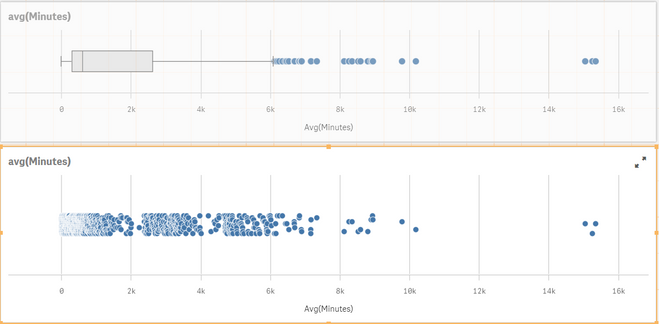
Box plot and distribution charts:
dimension: Minutes
Measure: Avg(Minutes)
mean is 614 (not correct)
can anybody help me with this?
thank you
625 Views
0 Replies
