Unlock a world of possibilities! Login now and discover the exclusive benefits awaiting you.

- Qlik Community
- :
- Forums
- :
- Analytics & AI
- :
- Products & Topics
- :
- Visualization and Usability
- :
- Re: create selectable bar chart in widget editor
- Subscribe to RSS Feed
- Mark Topic as New
- Mark Topic as Read
- Float this Topic for Current User
- Bookmark
- Subscribe
- Mute
- Printer Friendly Page

- Mark as New
- Bookmark
- Subscribe
- Mute
- Subscribe to RSS Feed
- Permalink
- Report Inappropriate Content
create selectable bar chart in widget editor
hi com,
how can i add the functionality to select a bar (country) in a bar chart.
I already build the bar chart in the editor, but i dont found anything that teaches me how to add the possiblity of interaction.
thx in advance.
- « Previous Replies
-
- 1
- 2
- Next Replies »
Accepted Solutions

 ikomlyakov1929
- Mark as New
- Bookmark
- Subscribe
- Mute
- Subscribe to RSS Feed
- Permalink
- Report Inappropriate Content
Hi, Eric!
I think i found solution!
Replace your div with bar class with that:
<div class="bar selectable" style="width:{{row.measures[0].getPercentOfMax()}}%"
ng-class="{'selected':row.dimensions[0].selected}" qva-activate="row.dimensions[0].select()">
- Mark as New
- Bookmark
- Subscribe
- Mute
- Subscribe to RSS Feed
- Permalink
- Report Inappropriate Content
Hi Eric,
If you have dimension in your Bar-Chart "Country", then you can click on Done button and click on the corresponding bar. It will provide the selection due to bar chosen.
Elena
 miguelbraga
- Mark as New
- Bookmark
- Subscribe
- Mute
- Subscribe to RSS Feed
- Permalink
- Report Inappropriate Content
Hey there,
All Bar Charts in my humble opinion are selectable. Just pick a country as you wish, and/or use the lasso when making selection and/or drag a line to select the Y values, like this:
1) Selecting normally:

Accept it and make it look like this:

2) Using lasso...

3) Using dragging...
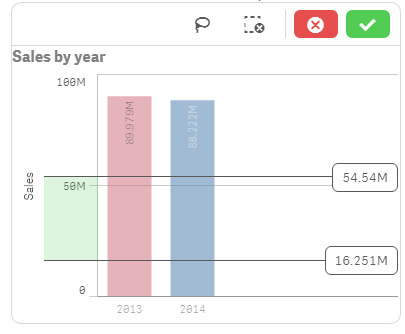
Hope this solves your question 
Regards,
MB
- Mark as New
- Bookmark
- Subscribe
- Mute
- Subscribe to RSS Feed
- Permalink
- Report Inappropriate Content
with the widget editor i created my own bar chart. I know how to select a standart Bar chart.
But i made a new one with widget editor with another appearance to test some.
And when i drag and drop my own chart into qlik sense there is no way of selecting anything.
Cause i dont implemented this!!!!
miguelbraga
- Mark as New
- Bookmark
- Subscribe
- Mute
- Subscribe to RSS Feed
- Permalink
- Report Inappropriate Content
Hi again,
Can you share a screenshot or a sample code?
Regards,
MB
- Mark as New
- Bookmark
- Subscribe
- Mute
- Subscribe to RSS Feed
- Permalink
- Report Inappropriate Content
here u see the chart with the standart barchart:
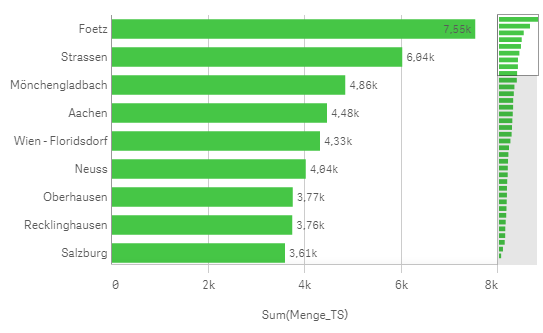
and now what I did
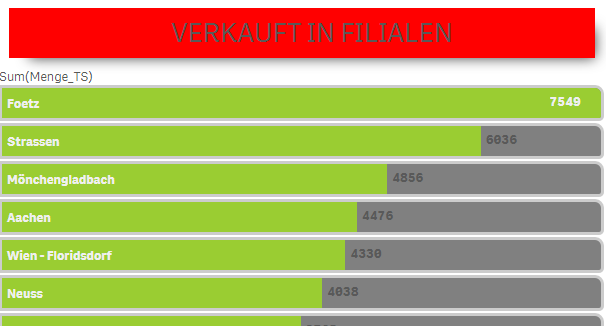
html:
<div style="height:100%;overflow:auto">
<div class="header"><span>verkauft in filialen</span></div>
<span>{{data.headers[1].qFallbackTitle}}</span>
<div ng-repeat="row in data.rows" class="row" title="{{row.dimensions[0].qText}}">
<div class="bar" style="width:{{row.measures[0].getPercentOfMax()}}%">
<span>{{row.dimensions[0].qText}}</span>
</div>
<div class="per">
<span class="{{row.measures[0].getPercentOfMax()>95 ? 'over':'' }}">{{row.measures[0].qText}}</span>
</div>
</div>
</div>
css
.header{
height: 50px;
line-height: 50px;
margin-left: 10px;
margin-right: 15px;
margin-bottom: 10px;
padding-left: 20px;
box-shadow: 10px 10px 19px -10px rgba(0,0,0,0.75);
text-align: center;
background-color: red;
span {
font-size: 20pt;
text-transform: uppercase;
}
}
@barColor: #5f5f5f;
.row { //hauptbalken
transition: all 0.3s ease;
float: left;
width: 98%;
overflow: hidden;
border: 3px solid #ccc;
background-color: grey;
margin-bottom: 2px;
border-radius: 0px 9px 5px 0px;
}
.bar { //balken
float: left;
clear: left;
height: 30px;
background-color: yellowgreen;
}
.bar span { //text filiale
font-weight: bold;
float: left;
margin-left: 5px;
margin-right: 5px;
margin-top: 7px;
color: #f0f0f0;
overflow: hidden;
text-overflow: ellipsis;
width: 90%;
white-space: nowrap;
}
.per {
position: relative; //wert hinter inner balken
}
.per span { //wert posi
font-weight: bold;
float: left;
margin-right: 5px;
margin-top: 5px;
margin-left: 5px;
}
.per span.over { //wert im balken
position: absolute;
right: 15px;
color: #f0f0f0;
}
- Mark as New
- Bookmark
- Subscribe
- Mute
- Subscribe to RSS Feed
- Permalink
- Report Inappropriate Content
thx for ur answer,
but i dont really understand what u mean. Can u share a screenshot?
ikomlyakov1929
- Mark as New
- Bookmark
- Subscribe
- Mute
- Subscribe to RSS Feed
- Permalink
- Report Inappropriate Content
Hi, Eric!
I think i found solution!
Replace your div with bar class with that:
<div class="bar selectable" style="width:{{row.measures[0].getPercentOfMax()}}%"
ng-class="{'selected':row.dimensions[0].selected}" qva-activate="row.dimensions[0].select()">
- Mark as New
- Bookmark
- Subscribe
- Mute
- Subscribe to RSS Feed
- Permalink
- Report Inappropriate Content
thx a lot! made my day!!
great solution thx for help
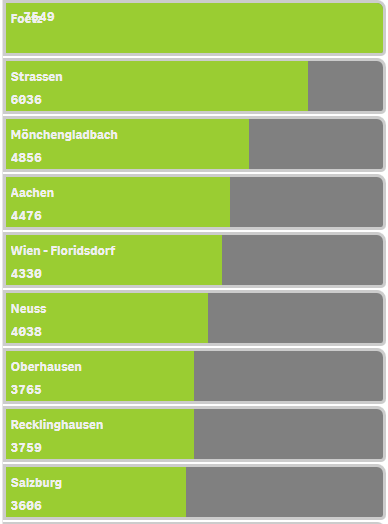
but now i have a problem with the numbers.
Sorry im quite new to html and css and i dont find out why the numbers are at this location now.
hope u can help!!!
ikomlyakov1929
- Mark as New
- Bookmark
- Subscribe
- Mute
- Subscribe to RSS Feed
- Permalink
- Report Inappropriate Content
Probably you've done a bit more than replacing your div with mine, because I've test it and do not have problem you face
- « Previous Replies
-
- 1
- 2
- Next Replies »