Unlock a world of possibilities! Login now and discover the exclusive benefits awaiting you.

- Qlik Community
- :
- Forums
- :
- Analytics & AI
- :
- Products & Topics
- :
- Visualization and Usability
- :
- Re: handling null values in line chart
- Subscribe to RSS Feed
- Mark Topic as New
- Mark Topic as Read
- Float this Topic for Current User
- Bookmark
- Subscribe
- Mute
- Printer Friendly Page

 dreweezy
- Mark as New
- Bookmark
- Subscribe
- Mute
- Subscribe to RSS Feed
- Permalink
- Report Inappropriate Content
handling null values in line chart
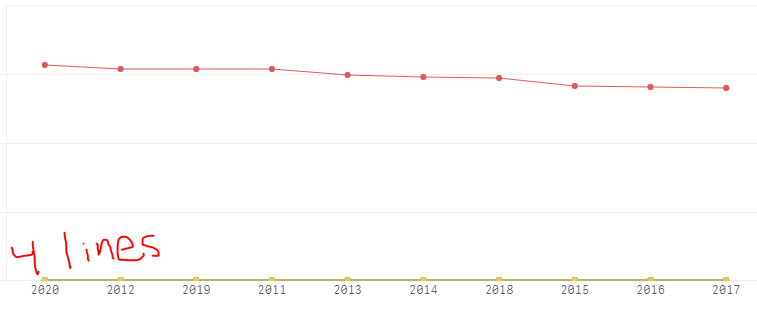
Hello, I have a line chart with multiple lines (these lines were manually created as our data is not pivoted to handle). Now, when a user goes and selects a value from a filter pane, it will show that specific line, but the other lines all drop to 0 on the x axis. I was hoping, upon selection of a value from the filter, it will only show 1 line but instead just drops the rest down to 0. Here is a snip of my problem.
How do I make it so upon selecting a filter value, the chart will only display that one line? I've tried excluding null values on the properties section and that doesn't do it.
Thanks.
- « Previous Replies
-
- 1
- 2
- Next Replies »
Accepted Solutions

 Kashyap_R
- Mark as New
- Bookmark
- Subscribe
- Mute
- Subscribe to RSS Feed
- Permalink
- Report Inappropriate Content
Hi
Please find the solution in the attachment
Hope it helps
Thanks
Kashyap.R
 Stoyan_Terziev
- Mark as New
- Bookmark
- Subscribe
- Mute
- Subscribe to RSS Feed
- Permalink
- Report Inappropriate Content
Hello Dreweezy,
You can hide it by placing a condition in the expression itself such as:
If (condition, Sum(LineAmount), Null())
And hide the legend if you have any.
But still the proper way is to make sure you've designed your chart as a line chart with 2 dimensions (Year and this dimension represented by the separate lines). There is no conditional show to turn it off.
Also - make sure to sort your chart by Year. 😉
I hope that helps!
Kind regards,
S.T.
Kashyap_R
- Mark as New
- Bookmark
- Subscribe
- Mute
- Subscribe to RSS Feed
- Permalink
- Report Inappropriate Content
Hi
Try by unchecking the "Include zero value" under Add-ons >> Data Handling.
Hope this helps
Thanks
Kashyap.R
dreweezy
- Mark as New
- Bookmark
- Subscribe
- Mute
- Subscribe to RSS Feed
- Permalink
- Report Inappropriate Content
I understand what you're saying.
Here is my condition for this chart. I will have multiple if statements.
if(Sum({<[DEPARTMENT] *= {'Marketing'}>} [REVENUE] > 0, 1, 0))
Not working right now, I need to work on my syntax but will this syntax work for the individual line itself?
dreweezy
- Mark as New
- Bookmark
- Subscribe
- Mute
- Subscribe to RSS Feed
- Permalink
- Report Inappropriate Content
So I updated my condition so it says
if(sum(REVENUE= 0), 0, 1)
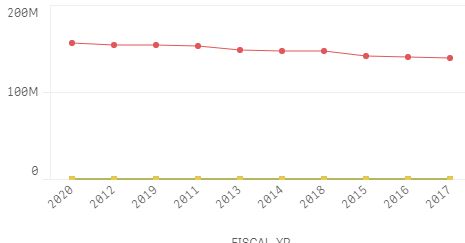
My thinking is with the 4 lines I have, since I select 1 value from the filter pane it will show me that line, and since the rest of the values are 0 it will not display. However, it leaves me in the same spot. The other lines are being pushed to the bottom at 0 on the x axis even with the condition in place.
Here is an updated snip.
 Stoyan_Terziev
- Mark as New
- Bookmark
- Subscribe
- Mute
- Subscribe to RSS Feed
- Permalink
- Report Inappropriate Content
Try Null() instead of 0.
dreweezy
- Mark as New
- Bookmark
- Subscribe
- Mute
- Subscribe to RSS Feed
- Permalink
- Report Inappropriate Content
I have uploaded a simple app with similar data. You can see if you select just one department, the other 2 line values go down to 0 on the x axis.
dreweezy
- Mark as New
- Bookmark
- Subscribe
- Mute
- Subscribe to RSS Feed
- Permalink
- Report Inappropriate Content
I've tried but no luck on this.
 santho_ak
- Mark as New
- Bookmark
- Subscribe
- Mute
- Subscribe to RSS Feed
- Permalink
- Report Inappropriate Content
Hi,
If possible, try changing that particular filter as 'alternate filter'. In that way, user will be able to select only one filter at a time. You can do so within the properties panes.
Regards,
Santhosh
Notes:
Alternative dimensions and measures are dimensions and measures that are added to a visualization, but are not displayed until a user chooses to switch which dimensions and measures are being displayed during visual exploration.
dreweezy
- Mark as New
- Bookmark
- Subscribe
- Mute
- Subscribe to RSS Feed
- Permalink
- Report Inappropriate Content
I do not want to limit # of filters a user can select. I'm just a bit confused as to why the other line are being pushed down. I'm unsuccessful using the calc condition to display or not. I will update once I find a solution.

- « Previous Replies
-
- 1
- 2
- Next Replies »