Unlock a world of possibilities! Login now and discover the exclusive benefits awaiting you.

- Qlik Community
- :
- Forums
- :
- Analytics & AI
- :
- Products & Topics
- :
- Visualization and Usability
- :
- link a expression chart with detail
- Subscribe to RSS Feed
- Mark Topic as New
- Mark Topic as Read
- Float this Topic for Current User
- Bookmark
- Subscribe
- Mute
- Printer Friendly Page

- Mark as New
- Bookmark
- Subscribe
- Mute
- Subscribe to RSS Feed
- Permalink
- Report Inappropriate Content
link a expression chart with detail
Hi, is it possible to link my bar chart with project detail?
Bar chart detail:
dimension: Phase
measure: Count(distinct {$<[Start Date] = {"$(='>=' & Date(monthstart(today(2)), 'D/M/YYYY') &'<=' & Date(monthend(today(2),2), 'D/M/YYYY'))"}>} [Project Title])
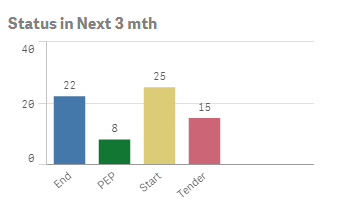
I would like to know how to link the bar chart with project detail, for example, when i click on PEP, there will be 8 project detail appear:)
thanks in advance

.png "Former Employee") Wuzhong_Zhu
Wuzhong_Zhu
- Mark as New
- Bookmark
- Subscribe
- Mute
- Subscribe to RSS Feed
- Permalink
- Report Inappropriate Content
Hi Lingling
All the fields should be associated automatically during loading. Not sure if I understand you problem correctly, but you may want to put a table chart with all the fields as dimension. The way Qix engine works is kinda different from traditional database/data warehouse, think about filtering instead of selecting.
Cheers

 Siva_Sankar
- Mark as New
- Bookmark
- Subscribe
- Mute
- Subscribe to RSS Feed
- Permalink
- Report Inappropriate Content
Find the attached example
- Mark as New
- Bookmark
- Subscribe
- Mute
- Subscribe to RSS Feed
- Permalink
- Report Inappropriate Content
Hi Lingling,
I'm not sure if i understand your question correctly as well. If your data model is linked correctly, when you click on any bar, having a Project details listbox next to it, it'll filter accordingly.
Or you can create a drill down dimension, when you click on a bar, it'll drill down the bar graph by Project details
- Mark as New
- Bookmark
- Subscribe
- Mute
- Subscribe to RSS Feed
- Permalink
- Report Inappropriate Content
Create a Drill Group which would be having two dimension like:
Project -> Project Title
Properties - > Dimension -> Edit Groups(Bottom Left) -> Select Drill Down ->Name a Proper Drill Group -> Add Dimension -> Project & Project Title..
Once you create it, add this drill group as a dimension..
- Mark as New
- Bookmark
- Subscribe
- Mute
- Subscribe to RSS Feed
- Permalink
- Report Inappropriate Content
Hi, I am not sure how to phrase it. When I click on the 'PEP' for example, it only filter the "Phase" field, what i want is filter on 'PEP' as well as the "start date"

 nizamsha
- Mark as New
- Bookmark
- Subscribe
- Mute
- Subscribe to RSS Feed
- Permalink
- Report Inappropriate Content
You can create a drill down if my understanding is correct
- Mark as New
- Bookmark
- Subscribe
- Mute
- Subscribe to RSS Feed
- Permalink
- Report Inappropriate Content
Sorry, I might not explain my question properly. This is an example of my data set, when I click on the 'PEP' bar in the bar chart, I should expected to see 8 lines in the table. But I think due to formula issue in the measure, the filter does not work out properly. Thus, I am trying to solve the issue.
| Project Title | Phase | Start Date | End Date |
| A | End | 1/8/2017 | 1/8/2017 |
| A | PEP | 1/1/2016 | 31/3/2016 |
| A | Start | 1/8/2016 | 31/7/2017 |
| A | Tender | 1/4/2016 | 31/7/2016 |
| B | End | 1/7/2018 | 1/7/2018 |
| B | PEP | 1/1/2016 | 31/3/2016 |
| B | Start | 1/8/2016 | 30/6/2018 |
| B | Tender | 1/4/2016 | 31/7/2016 |
| C | End | 1/1/2016 | 1/1/2016 |
| C | Start | 10/3/2015 | 31/12/2015 |
| C | Tender | 10/11/2014 | 9/3/2015 |
| D | End | 1/6/2016 | 1/6/2016 |
| D | Start | 1/1/2016 | 31/5/2016 |
| D | Tender | 1/9/2015 | 31/12/2015 |
| E | End | 1/12/2019 | 1/12/2019 |
| E | PEP | 1/6/2017 | 31/8/2017 |
| E | Start | 1/1/2018 | 30/11/2019 |
| E | Tender | 1/9/2017 | 31/12/2017 |
| F | End | 1/7/2016 | 1/7/2016 |