Unlock a world of possibilities! Login now and discover the exclusive benefits awaiting you.
- Qlik Community
- :
- Forums
- :
- Analytics & AI
- :
- Products & Topics
- :
- Visualization and Usability
- :
- Re: pie chart question
- Subscribe to RSS Feed
- Mark Topic as New
- Mark Topic as Read
- Float this Topic for Current User
- Bookmark
- Subscribe
- Mute
- Printer Friendly Page
- Mark as New
- Bookmark
- Subscribe
- Mute
- Subscribe to RSS Feed
- Permalink
- Report Inappropriate Content
pie chart question
I have a table
load *
inline [
id, sales, shipping, tax, discount
1, 100,2,5,-2
2,120,10,7.2,0
3,50,20,0,10
]
if i want to categorize: sale in to taxable, and others in notaxable.
how do I show them in a pie chart that I can drill down the taxable and nontaxable to the lowest level or can it even present in a table?
thanks!
Accepted Solutions
- Mark as New
- Bookmark
- Subscribe
- Mute
- Subscribe to RSS Feed
- Permalink
- Report Inappropriate Content
Try this script:
Temp:
CrossTable(TypeLv2,Value,1)
load *
inline [
id, sales, shipping, tax, discount
1, 100,2,5,-2
2,120,10,7.2,0
3,50,20,0,10
];
FinalData:
Load id,
If(TypeLv2 = 'sales', 'Taxable','Notaxable') as TypeLv1,
    TypeLv2,
    Value
Resident Temp;
Drop Table Temp;
Then create a drill-down dimension in your master items.
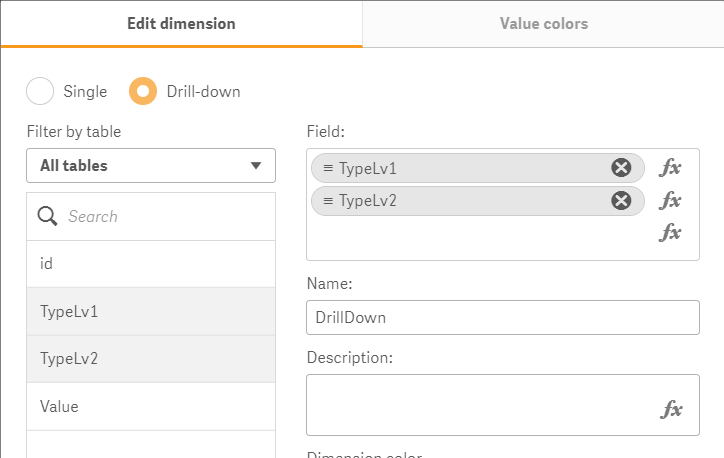
Create a pie chart:
+ Dimension: Your drilldown dimension
+ Measure: Sum(Value)
- Mark as New
- Bookmark
- Subscribe
- Mute
- Subscribe to RSS Feed
- Permalink
- Report Inappropriate Content
Try this script:
Temp:
CrossTable(TypeLv2,Value,1)
load *
inline [
id, sales, shipping, tax, discount
1, 100,2,5,-2
2,120,10,7.2,0
3,50,20,0,10
];
FinalData:
Load id,
If(TypeLv2 = 'sales', 'Taxable','Notaxable') as TypeLv1,
    TypeLv2,
    Value
Resident Temp;
Drop Table Temp;
Then create a drill-down dimension in your master items.
Create a pie chart:
+ Dimension: Your drilldown dimension
+ Measure: Sum(Value)