Unlock a world of possibilities! Login now and discover the exclusive benefits awaiting you.

Announcements
Share your agentic AI experience, learn from others, and earn a new badge: Put Agentic AI to Work
- Qlik Community
- :
- Forums
- :
- Analytics & AI
- :
- Products & Topics
- :
- Visualization and Usability
- :
- Re: range difference
Options
- Subscribe to RSS Feed
- Mark Topic as New
- Mark Topic as Read
- Float this Topic for Current User
- Bookmark
- Subscribe
- Mute
- Printer Friendly Page
Turn on suggestions
Auto-suggest helps you quickly narrow down your search results by suggesting possible matches as you type.
Showing results for

 ndeeleysww
Creator
2018-08-15
04:22 AM
- Mark as New
- Bookmark
- Subscribe
- Mute
- Subscribe to RSS Feed
- Permalink
- Report Inappropriate Content
range difference
Hello!
I have a simple combo chart that shows values:
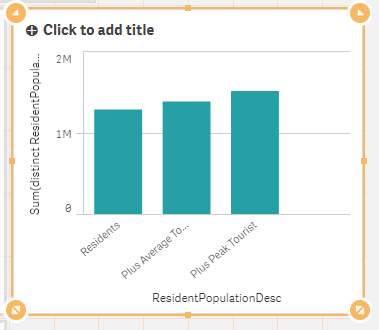
What I'd like to go now is show the range difference between the values - in this instance the increase between the bars as they step up.
Any ideas how I can go this?
Kind Regards
Neil
2,219 Views
1 Solution
Accepted Solutions

 Gysbert_Wassena
Partner - Champion III
2018-08-15
04:27 AM
- Mark as New
- Bookmark
- Subscribe
- Mute
- Subscribe to RSS Feed
- Permalink
- Report Inappropriate Content
Create a Waterfall chart: The new Waterfall chart
talk is cheap, supply exceeds demand
3 Replies
Gysbert_Wassena
Partner - Champion III
2018-08-15
04:27 AM
- Mark as New
- Bookmark
- Subscribe
- Mute
- Subscribe to RSS Feed
- Permalink
- Report Inappropriate Content
Create a Waterfall chart: The new Waterfall chart
talk is cheap, supply exceeds demand
 bwisealiahmad
Partner - Specialist
2018-08-15
04:28 AM
- Mark as New
- Bookmark
- Subscribe
- Mute
- Subscribe to RSS Feed
- Permalink
- Report Inappropriate Content
Hi,
I would look into using a Waterfall chart for this.
or look here
Waterfall chart - Qlik Sense - YouTube
Best,
Ali A
2,162 Views
ndeeleysww
Creator
2018-08-15
04:39 AM
Author
- Mark as New
- Bookmark
- Subscribe
- Mute
- Subscribe to RSS Feed
- Permalink
- Report Inappropriate Content
D'oh! Dim of me not to remember this one! Thanks to the both of you!
2,162 Views
