Unlock a world of possibilities! Login now and discover the exclusive benefits awaiting you.
- Qlik Community
- :
- Forums
- :
- Analytics & AI
- :
- Products & Topics
- :
- Visualization and Usability
- :
- replace null to zero in table chart
- Subscribe to RSS Feed
- Mark Topic as New
- Mark Topic as Read
- Float this Topic for Current User
- Bookmark
- Subscribe
- Mute
- Printer Friendly Page
- Mark as New
- Bookmark
- Subscribe
- Mute
- Subscribe to RSS Feed
- Permalink
- Report Inappropriate Content
replace null to zero in table chart
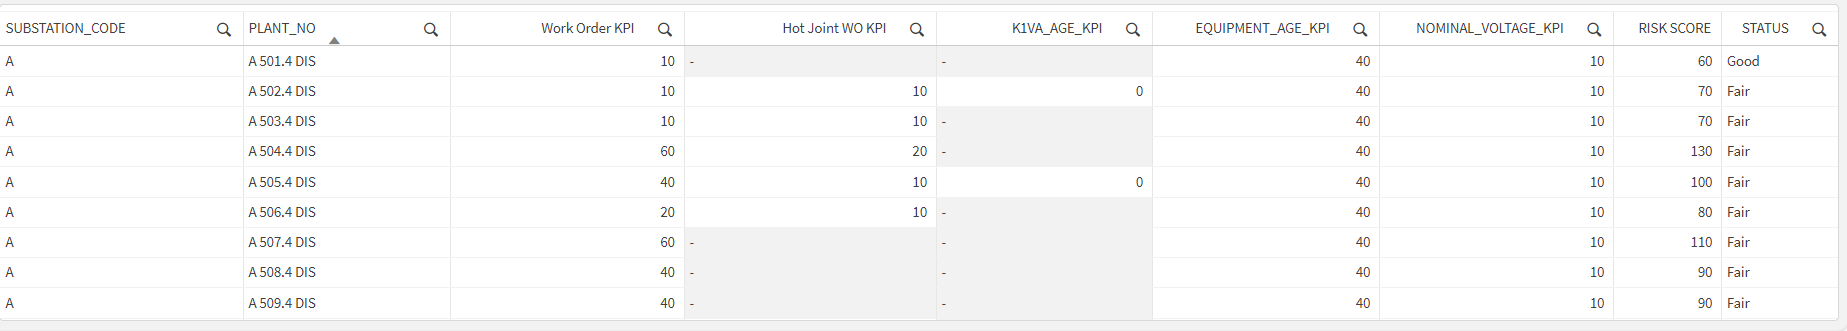
Hi There, I have a table where Plant_no groups WORK_ORDER_KPI, HOT_JOINT_KPI, and K1VA_AGE_KPI, and summing them in the pivot table to replace null to zero does not give the correct values. All I want is to replace null with 0. Note: all the columns comes from diffrent table/ model.
Any hacks will be much appreciated. I have attached the data and screenshot of a table view to this post.
- Subscribe by Topic:
-
dimension
-
expression
-
filter
-
General Question
-
Qlik Sense
-
Set Analysis
-
Variables
-
Visualization
Accepted Solutions
- Mark as New
- Bookmark
- Subscribe
- Mute
- Subscribe to RSS Feed
- Permalink
- Report Inappropriate Content
I think there is something wrong in your Load Script. These are my numbers with the Excel file you sent:

Read more at Data Voyagers - datavoyagers.net
Follow me on my LinkedIn | Know IPC Global at ipc-global.com
- Mark as New
- Bookmark
- Subscribe
- Mute
- Subscribe to RSS Feed
- Permalink
- Report Inappropriate Content
i believe so, i will check the data model.
- Mark as New
- Bookmark
- Subscribe
- Mute
- Subscribe to RSS Feed
- Permalink
- Report Inappropriate Content
If you want to fill the empty values with zeros you could use a mapping table:
Map_Null:
mapping load
Null(), 'Unkown'
AutoGenerate 1;
MAP K1VA_AGE_KPI using Map_Null;
[table name]:
load
EmptyIsNull(K1VA_AGE_KPI) as K1VA_AGE_KPI
etc.
you could also use an if-statement, if(len(trim(K1VA_AGE_KPI)) = 0, 'NA', K1VA_AGE_KPI) as ...
- Mark as New
- Bookmark
- Subscribe
- Mute
- Subscribe to RSS Feed
- Permalink
- Report Inappropriate Content
Hi, both ALT() and Coalesce() functions are used to handle null values or to provide alternative values when encountering nulls or missing data.
- Mark as New
- Bookmark
- Subscribe
- Mute
- Subscribe to RSS Feed
- Permalink
- Report Inappropriate Content
Hi @SterreKapteijns , and @BrunPierre
Thanks for getting back. Unfortunately, the code you provided is not working. That is because not all the plant_no (dimension) will have hot joint kpi attached. But if I remove the dimension and keep only the hot joint column, it appears correct.
I have attached the screenshot to show how the table looks when I remove the dimension column (Plant_no) without removing it.
I appreciate your guidance here.
- Mark as New
- Bookmark
- Subscribe
- Mute
- Subscribe to RSS Feed
- Permalink
- Report Inappropriate Content
What if you add these columns as Measures instead of Dimensions?

Read more at Data Voyagers - datavoyagers.net
Follow me on my LinkedIn | Know IPC Global at ipc-global.com
- Mark as New
- Bookmark
- Subscribe
- Mute
- Subscribe to RSS Feed
- Permalink
- Report Inappropriate Content
I tried to achieve this by summing it up. However, the summation gave me incorrect numbers. I randomly checked the number for Plant No: A801.4 DIS. It has a 50, 60, and 80 RISK SCORE , and it is correct; however, when I apply the summation it shows incorrect one. I hvae attached the sampel comparision below.
- Mark as New
- Bookmark
- Subscribe
- Mute
- Subscribe to RSS Feed
- Permalink
- Report Inappropriate Content
I think there is something wrong in your Load Script. These are my numbers with the Excel file you sent:
Read more at Data Voyagers - datavoyagers.net
Follow me on my LinkedIn | Know IPC Global at ipc-global.com
- Mark as New
- Bookmark
- Subscribe
- Mute
- Subscribe to RSS Feed
- Permalink
- Report Inappropriate Content
i believe so, i will check the data model.
- Mark as New
- Bookmark
- Subscribe
- Mute
- Subscribe to RSS Feed
- Permalink
- Report Inappropriate Content
The issue was in the data model. After revising the script, it is working fine. Thanks all for your time in addressing this.