Unlock a world of possibilities! Login now and discover the exclusive benefits awaiting you.

- Qlik Community
- :
- Forums
- :
- Analytics & AI
- :
- Products & Topics
- :
- Visualization and Usability
- :
- Re: table chart with max date expression
- Subscribe to RSS Feed
- Mark Topic as New
- Mark Topic as Read
- Float this Topic for Current User
- Bookmark
- Subscribe
- Mute
- Printer Friendly Page

 q11hhg
- Mark as New
- Bookmark
- Subscribe
- Mute
- Subscribe to RSS Feed
- Permalink
- Report Inappropriate Content
table chart with max date expression
I have a measure that calcuates the last 12 months customers:
count({$<
[Event Type] = {'Login'},
[Customer ID] = {"=sum([Total Events])>=2"},
Date={">=$(=date(addmonths(Max(Date),-12),'YYYY-MM-DD'))<=$(=date(Max(Date),'YYYY-MM-DD'))"}
>} distinct [Customer ID] )
When I add this to a table chart, each row only shows the number of customers in that month, instead of calculating back 12 months.
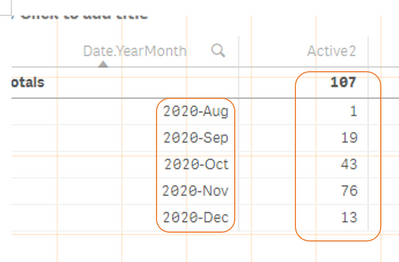
The expected result should be , for example, in the first row 2020-Aug, the measure should calculate starting from 2019-Aug until 2020-Aug.

 Chanty4u
- Mark as New
- Bookmark
- Subscribe
- Mute
- Subscribe to RSS Feed
- Permalink
- Report Inappropriate Content
Use this as your calculated dimension and try to filter other values and check
If(Date >= AddMonths(Today(), -12), Date)
or try
Script:
If(Date <= Today() And Date >= SetDateYear(Today(), Year(Today())-1), 1, 0) As Last12Months
Set Analysis:
=Count({< Last12Months = {1}>} Date)
