Unlock a world of possibilities! Login now and discover the exclusive benefits awaiting you.
- Qlik Community
- :
- Forums
- :
- Analytics & AI
- :
- Products & Topics
- :
- Visualization and Usability
- :
- Re: the best way of date comparison
- Subscribe to RSS Feed
- Mark Topic as New
- Mark Topic as Read
- Float this Topic for Current User
- Bookmark
- Subscribe
- Mute
- Printer Friendly Page
- Mark as New
- Bookmark
- Subscribe
- Mute
- Subscribe to RSS Feed
- Permalink
- Report Inappropriate Content
the best way of date comparison
Hi Folks, i got a question,
there are two date fields: confirmed date and scheduled date, they do look like:
confirmed date scheduled date
03.10.2018 15.11.2018
01.12.2018 15.12.2018
03.12.2018 12.01.2019
my question is: how can i compare these dates,
confirmed date scheduled date
03.12.2018 12.01.2019
one solution that i have found does look like:
(if(right(year(confirmed date),4) < right(year(scheduled date),4) , 1, 2 ) as flag (here i compare two fields by using of function right() and year().
my question is, what if, if i should compare the date fields like:
confirmed date scheduled date
03.10.2018 15. 11. 2018 (to compare between 2 Months)
01.12.2018 15.12.2018 (to compare within one Month)
Does anybody have any idea how to resolve this issue? Thanks a lot in advance
Beck
- « Previous Replies
-
- 1
- 2
- Next Replies »
- Mark as New
- Bookmark
- Subscribe
- Mute
- Subscribe to RSS Feed
- Permalink
- Report Inappropriate Content
Try this:
Num(Date#([confirmed date],'dd.mm.yyyy')) < Num(Date#([scheduled date],'dd.mm.yyyy'))
Thanks!
- Mark as New
- Bookmark
- Subscribe
- Mute
- Subscribe to RSS Feed
- Permalink
- Report Inappropriate Content
First of all is confirm that you are reading date, and not strings. Using Date#() you can set the input format of the date: Date#([confirmed date], 'DD.MM.YYYY') as [confirmed date in date]
Comparison can be done as:
If(AddMonths([confirmed date in date], 1)>=[scheduled date in date], 1, 0) as isWithinOneMonth
- Mark as New
- Bookmark
- Subscribe
- Mute
- Subscribe to RSS Feed
- Permalink
- Report Inappropriate Content
Hi Rubenmarin,
first of all, thanks a lot for your responce,
my issue is, i have the following data:
confirmed date scheduled date Turnover
03.10.2018 15.11.2018 5
01.12.2018 15.12.2018 15
03.12.2018 12.01.2019 20
if my my scheduled date greater than confirmed date than the expression: Turnover should display only 20 (20 i can show, because, as you see my scheduled date, is indeed greater than my confirmed date > i make it possible by using of function: year() : if(year(confirmed date) < year(scheduled date) , 1, 2) as flag : then i use the following expression: Sum ({$<flag = {2}>}Turnover), so whithin of my barchart i see only: 20
but what if i compare two fields: confirmed date and scheduled date within one month: 01.12.2018, 15.12.2018 ,15 and
within one year:03.10.2018, 15.11.2018.
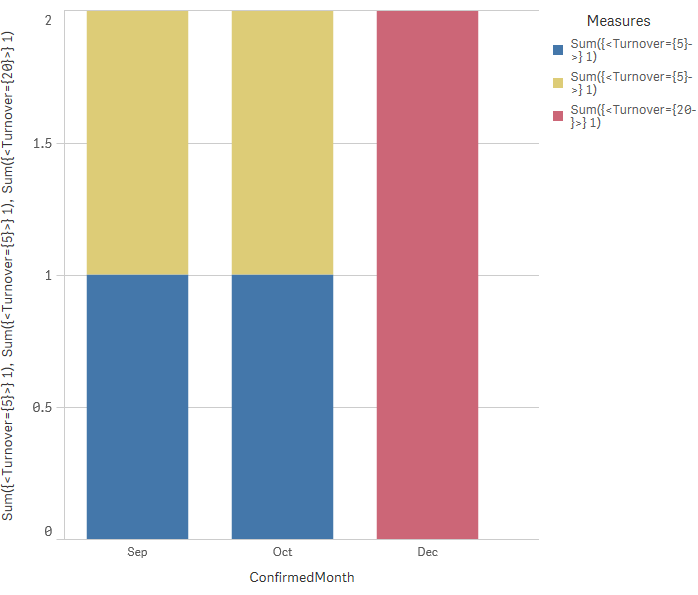
Within my barchart i want to see: Dim: Month: Nov = 5, Dec = 15 ( 2018) and Jan = 20 (2019)
i hope i explaned well enough, if not please let me know
- Mark as New
- Bookmark
- Subscribe
- Mute
- Subscribe to RSS Feed
- Permalink
- Report Inappropriate Content
Hi Beck,
If I understood correctly,
- Turnover = 5 when confirmed date and scheduled date within the same Year, but different Month
- Turnover = 15 when confirmed date and scheduled date within one Year, within the same Month
- Turnover = 20 when confirmed date and scheduled date are in different Year
So, it might be like this:
If(Year(Date#([confirmed date],'dd.mm.yyyy')=Year(Date#([scheduled date],'dd.mm.yyyy') AND Month(Date#([confirmed date],'dd.mm.yyyy')=Month(Date#([scheduled date],'dd.mm.yyyy'), 15,
If(Year(Date#([confirmed date],'dd.mm.yyyy')=Year(Date#([scheduled date],'dd.mm.yyyy') , 5,
If(Year(Date#([confirmed date],'dd.mm.yyyy')<Year(Date#([scheduled date],'dd.mm.yyyy') , 20
))) as flag
Your expression will be like this:
Sum ({$<flag = {20}>}Turnover)
- Mark as New
- Bookmark
- Subscribe
- Mute
- Subscribe to RSS Feed
- Permalink
- Report Inappropriate Content
Hi Bgerchikov,
first of all thanks a lot for you responce,
my issue is: i want create on base of fields: confirmed date and scheduled date the dimension: Month, on the base of this dimension i want show only the amounts from field: Turnover:
within of my barchart i want see: Dim = Month and Expression: Turnover for Example:
Dimension: Month > Nov, Dez, Jan and Expression: 5, 15 ,20
i hope i explained well enough, if not please let me know
- Mark as New
- Bookmark
- Subscribe
- Mute
- Subscribe to RSS Feed
- Permalink
- Report Inappropriate Content
Hi Beck,
Probably you should decide how to connect calendar Month with your dates. Should it be confirmed date or scheduled date? I'd suggest to do this in the script, and associate the Month with Turnover value. Then you will not have any problem in your chart.
Good luck!
- Mark as New
- Bookmark
- Subscribe
- Mute
- Subscribe to RSS Feed
- Permalink
- Report Inappropriate Content
Thanks a lot for your feedback,
can i switch between two fields?
- Mark as New
- Bookmark
- Subscribe
- Mute
- Subscribe to RSS Feed
- Permalink
- Report Inappropriate Content
You may need something like this:
TempData:
Load * Inline
[
confirmed date,scheduled date
03.10.2018,15.11.2018
01.12.2018,15.12.2018
03.12.2018,12.01.2019
03.09.2018,15.11.2018
01.12.2018,15.12.2018
01.12.2018,12.01.2019
];
Data:
Load *,
Year(Date#([confirmed date],'DD.MM.YYYY')) AS ConfirmedYear,
Month(Date#([confirmed date],'DD.MM.YYYY')) AS ConfirmedMonth,
Year(Date#([scheduled date],'DD.MM.YYYY')) AS ScheduledYear,
Month(Date#([scheduled date],'DD.MM.YYYY')) AS ScheduledMonth,
If(Year(Date#([confirmed date],'DD.MM.YYYY'))=Year(Date#([scheduled date],'DD.MM.YYYY'))
AND Month(Date#([confirmed date],'DD.MM.YYYY'))=Month(Date#([scheduled date],'DD.MM.YYYY')), 15,
If(Year(Date#([confirmed date],'DD.MM.YYYY'))=Year(Date#([scheduled date],'DD.MM.YYYY'))
AND Month(Date#([confirmed date],'DD.MM.YYYY'))<> Month(Date#([scheduled date],'DD.MM.YYYY')), 5,
If(Year(Date#([confirmed date],'DD.MM.YYYY'))<Year(Date#([scheduled date],'DD.MM.YYYY')) , 20
))) as Turnover
Resident TempData
;
drop Table TempData;
- Mark as New
- Bookmark
- Subscribe
- Mute
- Subscribe to RSS Feed
- Permalink
- Report Inappropriate Content
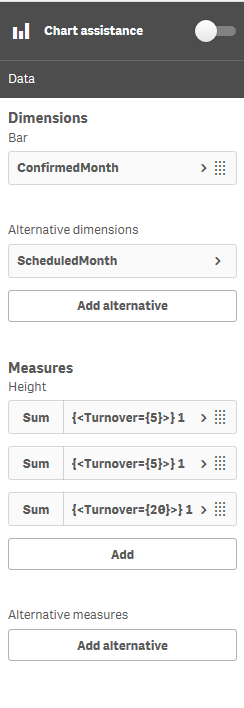
Switching your dimension may be implemented in the chart. Just use alternative dimension option
- « Previous Replies
-
- 1
- 2
- Next Replies »