Unlock a world of possibilities! Login now and discover the exclusive benefits awaiting you.
- Qlik Community
- :
- Forums
- :
- Analytics & AI
- :
- Products & Topics
- :
- Visualization and Usability
- :
- total value
- Subscribe to RSS Feed
- Mark Topic as New
- Mark Topic as Read
- Float this Topic for Current User
- Bookmark
- Subscribe
- Mute
- Printer Friendly Page
- Mark as New
- Bookmark
- Subscribe
- Mute
- Subscribe to RSS Feed
- Permalink
- Report Inappropriate Content
total value
Hello everyone,
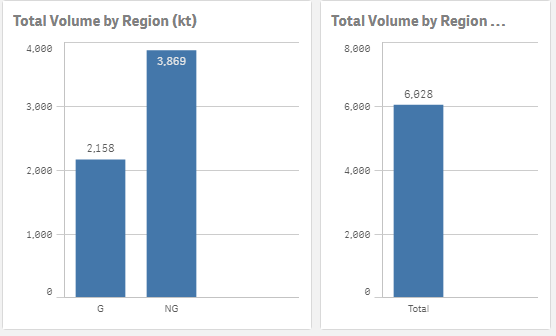
I have a bar chart with the dimension of 'TO_GROUP_OF_THIRD_PARTY' which has two values;
G for Group companies
NG for Non-Group companies.
Requirement is they also want to see the total values of G + NG values in bar chart with G and NG values. How can I get a bar chart with dimension of 'TO_GROUP_OF_THIRD_PARTY' and with values 'G','NG','Total'
they want to see the below charts in single bar chart with the dimension of TO_GROUP_OF_THIRD_PARTY.
meausure is sum of quantity.
Please suggest me any solution if anyone of you gone through the same problem.
Please suggest any appropriate solution...
Thanks.
OY
- Mark as New
- Bookmark
- Subscribe
- Mute
- Subscribe to RSS Feed
- Permalink
- Report Inappropriate Content
Hi,
take a look at this, you have multiple solution
- Mark as New
- Bookmark
- Subscribe
- Mute
- Subscribe to RSS Feed
- Permalink
- Report Inappropriate Content
try this
Dim
=ValueList('Total')
Measure
if(Valuelist('Total') = 'Total',Sum(G)+Sum(NG))
- Mark as New
- Bookmark
- Subscribe
- Mute
- Subscribe to RSS Feed
- Permalink
- Report Inappropriate Content
Hi Jahanzeb, thank you for your kind help.
As far as I understand, suggested code only shows the Total values, but I need all the values(G, NG, Total) in single bar chart.
- Mark as New
- Bookmark
- Subscribe
- Mute
- Subscribe to RSS Feed
- Permalink
- Report Inappropriate Content
I think you can show all three have you given a try?
- Mark as New
- Bookmark
- Subscribe
- Mute
- Subscribe to RSS Feed
- Permalink
- Report Inappropriate Content
=ValueList('Total','G','NG')
if(Valuelist('Total','G','NG') = 'Total',Sum(G)+Sum(NG),if(Valuelist('Total','G','NG') = 'G',Sum(G),Sum(NG))
- Mark as New
- Bookmark
- Subscribe
- Mute
- Subscribe to RSS Feed
- Permalink
- Report Inappropriate Content
Many thanks for the prompt reply, this worked perferctly for me.