Unlock a world of possibilities! Login now and discover the exclusive benefits awaiting you.
- Qlik Community
- :
- All Forums
- :
- QlikView
- :
- WHat is ValueList() and ValueLoop() ?? How they ar...
- Subscribe to RSS Feed
- Mark Topic as New
- Mark Topic as Read
- Float this Topic for Current User
- Bookmark
- Subscribe
- Mute
- Printer Friendly Page
- Mark as New
- Bookmark
- Subscribe
- Mute
- Subscribe to RSS Feed
- Permalink
- Report Inappropriate Content
WHat is ValueList() and ValueLoop() ?? How they are used ??
WHat is ValueList() and ValueLoop() ?? How they are used ?? Can anyone explain with example ??
Thanks
- Tags:
- new_to_qlikview
- Mark as New
- Bookmark
- Subscribe
- Mute
- Subscribe to RSS Feed
- Permalink
- Report Inappropriate Content
- Mark as New
- Bookmark
- Subscribe
- Mute
- Subscribe to RSS Feed
- Permalink
- Report Inappropriate Content
did you try online help?
Synthetic Dimension Functions
ValueList (value {, value })
Returns a set of listed values which, when used in a calculated dimension, will form a synthetic dimension. In charts with a synthetic dimension created with the valuelist function it is possible to reference the dimension value corresponding to a specific expression cell by restating the valuelist function with the same parameters in the chart expression. The function may of course be used anywhere in the layout, but apart from when used for synthetic dimensions it will only be meaningful inside an aggregation function.
Examples:
valuelist ( 1, 10, 100 )
valuelist ( 'a', 'xyz', 55 )
ValueLoop(from [, to [, step = 1 ]])
Returns a set of iterated values which, when used in a calculated dimension, will form a synthetic dimension. The values generated will start with the from value and end with the to value including intermediate values in increments of step. In charts with a synthetic dimension created with the valueloop function it is possible to reference the dimension value corresponding to a specific expression cell by restating the valueloop function with the same parameters in the chart expression. The function may of course be used anywhere in the layout, but apart from when used for synthetic dimensions it will only be meaningful inside an aggregation function.
Examples:
valueloop ( 1, 3 ) returns the values 1, 2 and 3
valueloop ( 1, 5, 2 ) returns the values 1, 3 and 5
valueloop ( 11 ) returns the value 11
- Mark as New
- Bookmark
- Subscribe
- Mute
- Subscribe to RSS Feed
- Permalink
- Report Inappropriate Content
valuelist() and valueloop() are used to create artificial dimensions and expressions in charts
here valuelist takes a arbitary list of strings to create and valueloop takes a number sequence to create
- Mark as New
- Bookmark
- Subscribe
- Mute
- Subscribe to RSS Feed
- Permalink
- Report Inappropriate Content
Hey,
Thnx for the reply but i did not get anything . I did not get what is calculated dimension and synthetic dimension.
Please , can you explain it in simpler way.
Thanks
- Mark as New
- Bookmark
- Subscribe
- Mute
- Subscribe to RSS Feed
- Permalink
- Report Inappropriate Content
hi ,
1.synthetic dimension functions (valuelist &value loop).
2. dimension wise it 'll display tthe values.
For Example:
syn: valuelist('1','5') it'll display the only 1&5 values
valueloo('1','5') it'll display the all( 1,2,3,4,5 values)
- Mark as New
- Bookmark
- Subscribe
- Mute
- Subscribe to RSS Feed
- Permalink
- Report Inappropriate Content
A dimension can be
- a single field
- a group
- an expression (calculated dimension).
Synthetic dimension is a calculated dimension with valueloop or valuelist function
To create a calculated dimension ....
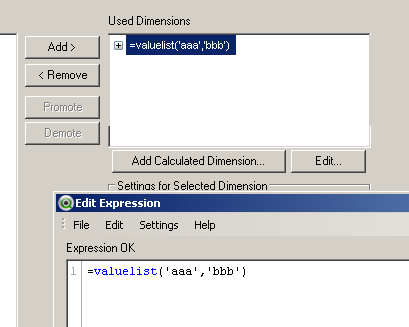
in the attachment and image also an example of synthetic dimension
dimension = valuelist('aaa','bbb')
expression = if(ValueList('aaa','bbb')='aaa', 100, 150)
- Mark as New
- Bookmark
- Subscribe
- Mute
- Subscribe to RSS Feed
- Permalink
- Report Inappropriate Content
HEy ,
I am using free version of qlikview , so cannot open your example. But can you please explain when and how valuelist() and valueloop() used ?? ANd also what do you mean by synthetic dimension and calculated dimension ??
Thanks.
- Mark as New
- Bookmark
- Subscribe
- Mute
- Subscribe to RSS Feed
- Permalink
- Report Inappropriate Content
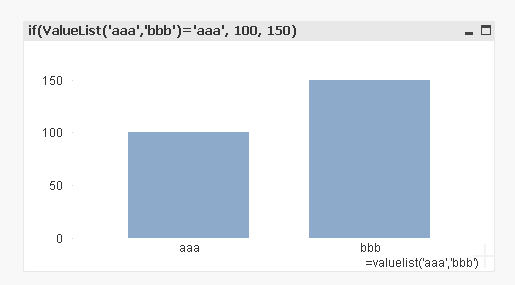
just make a new doc without script
create a bar chart and add the dimension and expression
dimension = valuelist('aaa','bbb')
expression = if(ValueList('aaa','bbb')='aaa', 100, 150)