Unlock a world of possibilities! Login now and discover the exclusive benefits awaiting you.
- Qlik Community
- :
- All Forums
- :
- QlikView App Dev
- :
- Stacked Bar Chart
- Subscribe to RSS Feed
- Mark Topic as New
- Mark Topic as Read
- Float this Topic for Current User
- Bookmark
- Subscribe
- Mute
- Printer Friendly Page
- Mark as New
- Bookmark
- Subscribe
- Mute
- Subscribe to RSS Feed
- Permalink
- Report Inappropriate Content
Stacked Bar Chart
Hi,
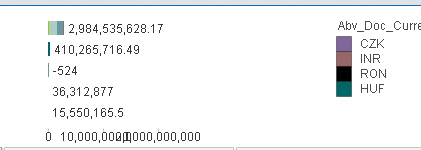
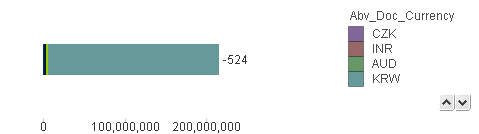
I built a stacked bar chart, that has different colors for multiple currencies. Values displayed on the data points. Y-value sorted descending. However, in the graph it looks like this (-524 is just a value for one currency in that bar, total value there is 209,000,000).
and yes I know that adding up different currencies is not great representation, but it has to be done, and sorted.
is there a way to display the actual 209,000,000 or to display sums of each currency?
- Mark as New
- Bookmark
- Subscribe
- Mute
- Subscribe to RSS Feed
- Permalink
- Report Inappropriate Content
Can you attach some sample data?
- Mark as New
- Bookmark
- Subscribe
- Mute
- Subscribe to RSS Feed
- Permalink
- Report Inappropriate Content
the fields I use is customers, amount, and currency
- Mark as New
- Bookmark
- Subscribe
- Mute
- Subscribe to RSS Feed
- Permalink
- Report Inappropriate Content
These are actually all the values that are summed in the bar showing -524, any ideas why does it only show the sum of two negative numbers.
| 113219 |
| 8000 |
| 50000 |
| 4580 |
| -500 |
| 209000000 |
| 2800000 |
| 24000 |
| 1009050 |
| 1000 |
| -24 |
| 2344497.71 |
| 2000 |
| 1500 |
- Mark as New
- Bookmark
- Subscribe
- Mute
- Subscribe to RSS Feed
- Permalink
- Report Inappropriate Content
Attach sample qvw.
- Mark as New
- Bookmark
- Subscribe
- Mute
- Subscribe to RSS Feed
- Permalink
- Report Inappropriate Content
I also found this question someone asked, but no valid answer there as well