Unlock a world of possibilities! Login now and discover the exclusive benefits awaiting you.
- Qlik Community
- :
- All Forums
- :
- QlikView App Dev
- :
- Value in bubbles on animated scatter chart
- Subscribe to RSS Feed
- Mark Topic as New
- Mark Topic as Read
- Float this Topic for Current User
- Bookmark
- Subscribe
- Mute
- Printer Friendly Page
- Mark as New
- Bookmark
- Subscribe
- Mute
- Subscribe to RSS Feed
- Permalink
- Report Inappropriate Content
Value in bubbles on animated scatter chart
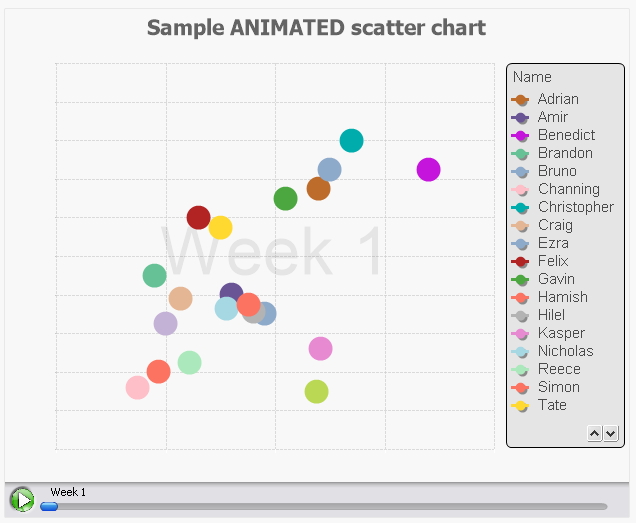
I have a scatter chart being animated through a few weeks. Everything works ok but my problem is that I have 30+ bubbles per week and their colors repeat, meaning that 2 or more bubbles may share the same color, like this:
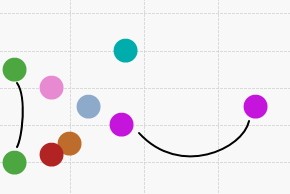
Each bubble represents a person and the legend is something like this:
1-Mike
2-Theresa
3-Anne
4-John
...
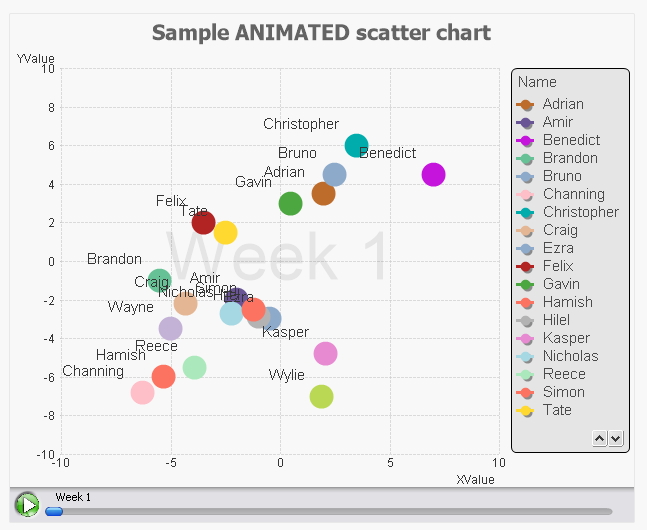
I would love to be able to show the numbers inside the bubbles, so that users can easily find which person the bubble represents.
Is it possible to do this? How to show a just the numbers in the bubbles?
Thanks!!!
- Tags:
- new_to_qlikview
- Mark as New
- Bookmark
- Subscribe
- Mute
- Subscribe to RSS Feed
- Permalink
- Report Inappropriate Content
Hi,
Do you need like this?
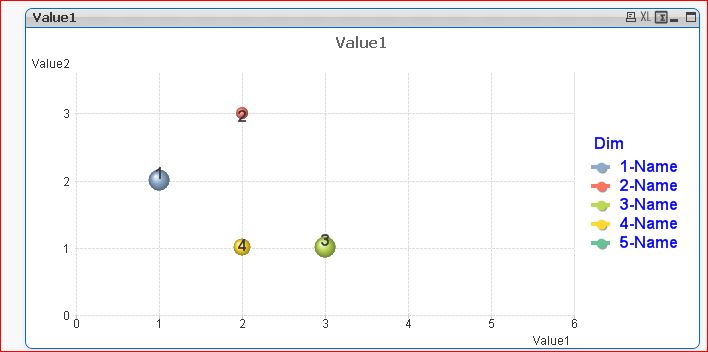
If so,
Create one Calculated dimension (should be on top position).. and the expression
=SubField(DimensionName,'-',1) (Uncheck Show Legend)
Goto the Presentation Tab -> Check Labels on Data Points
Sample Attached.
- Mark as New
- Bookmark
- Subscribe
- Mute
- Subscribe to RSS Feed
- Permalink
- Report Inappropriate Content
You can show the values by selecting Labels on Data points on the presentation tab. But it show both X & Y axis values.
The other technique is write the expression for bubble & it show bigger value.
You can write the BG color each dimension value if you want
- Mark as New
- Bookmark
- Subscribe
- Mute
- Subscribe to RSS Feed
- Permalink
- Report Inappropriate Content
Hi Settu,
Thanks for your help. As I said I have a scatter chart being animated, and for that, the dimension I am animating through (week) has to be the 1st dimension if I am not mistaken.
- Mark as New
- Bookmark
- Subscribe
- Mute
- Subscribe to RSS Feed
- Permalink
- Report Inappropriate Content
Dathu,
My chart is being animated and option #1 doesn't do anything for me.
Can you please expand on how to write color for each dimension value?
Thanks! 
- Mark as New
- Bookmark
- Subscribe
- Mute
- Subscribe to RSS Feed
- Permalink
- Report Inappropriate Content
Hi,
May be Let us try, if you post the sample qvw?
- Mark as New
- Bookmark
- Subscribe
- Mute
- Subscribe to RSS Feed
- Permalink
- Report Inappropriate Content
My original problem was that nothing was being shown in the bubbles, even with the proper checkboxes checked.
I just realized the problem - I wanted the Y and X axis not show any values, so I set the font to transparent:
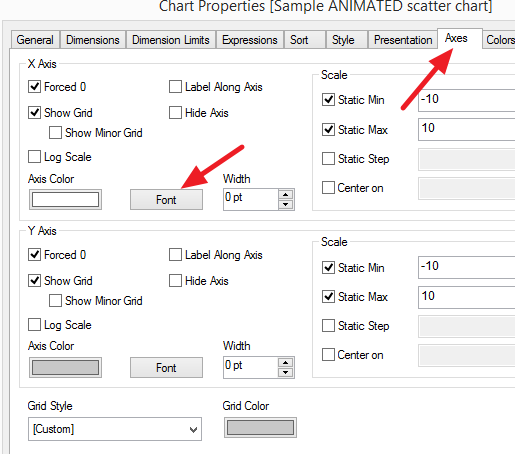
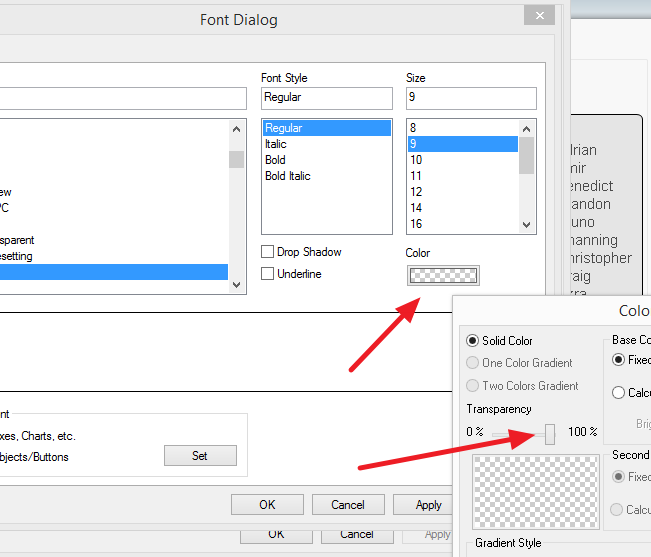
After changing the font color I can see values in the bubbles, but unfortunately, values along the axes.
My question finally is:
How to hide values along the axes and still have values in the bubbles?
(QV12 sample attached)
Thanks!
- Mark as New
- Bookmark
- Subscribe
- Mute
- Subscribe to RSS Feed
- Permalink
- Report Inappropriate Content
One more comment about this. Colors and fonts come from different places. It's crazy!!!
The font color of the labels is set in the X axis. But the font size, style, etc, are set in the LEGEND font configuration.
Not intuitive at all to say the least.