Unlock a world of possibilities! Login now and discover the exclusive benefits awaiting you.
- Qlik Community
- :
- All Forums
- :
- QlikView
- :
- Which chart type is this and are there examples ho...
- Subscribe to RSS Feed
- Mark Topic as New
- Mark Topic as Read
- Float this Topic for Current User
- Bookmark
- Subscribe
- Mute
- Printer Friendly Page
- Mark as New
- Bookmark
- Subscribe
- Mute
- Subscribe to RSS Feed
- Permalink
- Report Inappropriate Content
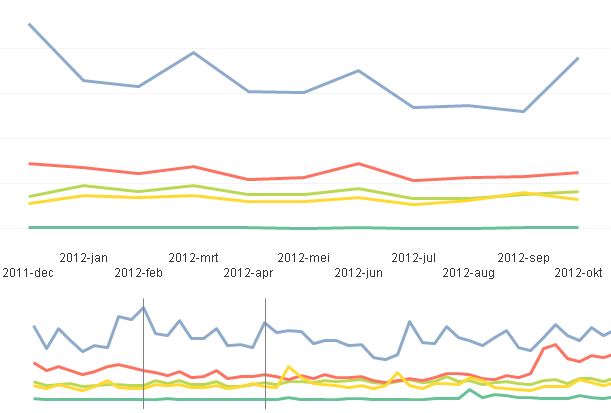
Which chart type is this and are there examples how to create one
I started creating such type of graph and it could use some improvement.
But I don't know the name 🙂
And are there examples on the community.
update: it doesn't matter if there are 2 or 3 types of graph. The main focus is that one graph has all the history and the chart above zooms into the selected area of the chart below.
in this example the lower graph selects 1 year and in the graph above you see more details.
update 2: closest thing I could find was "zoom chart"

- Mark as New
- Bookmark
- Subscribe
- Mute
- Subscribe to RSS Feed
- Permalink
- Report Inappropriate Content
That is a panel chart composed of one line chart, one bar chart and one area chart. In Qlikview you need to create either three separate charts or create an extension object that can do that. It's probably possible with an extension using the D3.js and/or NVD3 javascript libraries.
talk is cheap, supply exceeds demand
- Mark as New
- Bookmark
- Subscribe
- Mute
- Subscribe to RSS Feed
- Permalink
- Report Inappropriate Content
may be this
- Mark as New
- Bookmark
- Subscribe
- Mute
- Subscribe to RSS Feed
- Permalink
- Report Inappropriate Content
With panel chart you mean 2 or more graphs next to each other? If I google it I don't get the expected result. It's too generic.
Doesn't it have an other name then panel chart?
I made something in QV but it still needs some perfection. But if I don't know the name I can't search for better examples.
- Mark as New
- Bookmark
- Subscribe
- Mute
- Subscribe to RSS Feed
- Permalink
- Report Inappropriate Content
If I'm not mistaken, this is how Qlik Sense lets you navigate through wide line/bar charts by default. Unfortunately with just two panels, not three.
- Mark as New
- Bookmark
- Subscribe
- Mute
- Subscribe to RSS Feed
- Permalink
- Report Inappropriate Content
Try searching Bump charts