Unlock a world of possibilities! Login now and discover the exclusive benefits awaiting you.
- Qlik Community
- :
- All Forums
- :
- QlikView App Dev
- :
- Aggr and Set analysis
- Subscribe to RSS Feed
- Mark Topic as New
- Mark Topic as Read
- Float this Topic for Current User
- Bookmark
- Subscribe
- Mute
- Printer Friendly Page
- Mark as New
- Bookmark
- Subscribe
- Mute
- Subscribe to RSS Feed
- Permalink
- Report Inappropriate Content
Aggr and Set analysis
Will somebody help me with the following situation?
For each contract I want to have the sum of the contract value --> sum(aggr(_Amount_Fields),Field_Number)
This sum of contract value I want to present it cumulative in time (from current month till future months) with:
Sum({< Flag Rolling Months={1}>}0.0000000001)
+
Sum(aggr( {< Flag Rolling Months={1} >} _Amount_Fields),Field_Number) --> What is the right way?
Example values:
June: 15.000
August: 5.000
December: 2.000
The end result will be:
| June | July | Aug | Sept | Oct | Nov | Dec |
|---|---|---|---|---|---|---|
| 15.000 | 15.000 | 20.000 (+5.000) | 20.000 | 20.000 | 20.000 | 22.000 (+2.000) |
Accepted Solutions
- Mark as New
- Bookmark
- Subscribe
- Mute
- Subscribe to RSS Feed
- Permalink
- Report Inappropriate Content
You must have an agregation expression inside your AGGR() function
sum( {< Flag Rolling Months={1} >} aggr(sum( {< Flag Rolling Months={1} >} _Amount_Fields),Field_Number))
I recommed this post: Set Analysis in the Aggr function and this Pitfalls of the Aggr function
- Mark as New
- Bookmark
- Subscribe
- Mute
- Subscribe to RSS Feed
- Permalink
- Report Inappropriate Content
Neither Aggr() nor set analysis are required to do this. Do you want to this in the front end or in script? In the front end, something like this expression in a table with month as the dimension:
=RangeSum(Above(Sum(_Amount_Fields), 0, Rowno()))
- Mark as New
- Bookmark
- Subscribe
- Mute
- Subscribe to RSS Feed
- Permalink
- Report Inappropriate Content
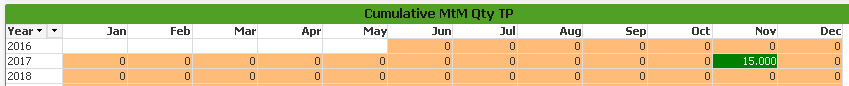
Thanks for your fast reply! This is the result of your solution. How can I present the 15.000 also in the coming months Dec 2017 till dec 2018?
- Mark as New
- Bookmark
- Subscribe
- Mute
- Subscribe to RSS Feed
- Permalink
- Report Inappropriate Content
Thanks for your fast reply. This is the result of your solution. In this example I have 15.000 in November 2017. From this period I want to present the 15.000 in the coming months Dec 2017 till dec 2018? How can I do this?
A solution in script is also welcome!
- Mark as New
- Bookmark
- Subscribe
- Mute
- Subscribe to RSS Feed
- Permalink
- Report Inappropriate Content
It would be easier if you share a sample of your app
Preparing examples for Upload - Reduction and Data Scrambling
- Mark as New
- Bookmark
- Subscribe
- Mute
- Subscribe to RSS Feed
- Permalink
- Report Inappropriate Content
Seeing that you have miltipe dimensions, you will get better results with
=RangeSum(Above(total Sum(_Amount_Fields), 0, Rowno()))
or
=RangeSum(Before(total Sum(_Amount_Fields), 0, Colno()))
- Mark as New
- Bookmark
- Subscribe
- Mute
- Subscribe to RSS Feed
- Permalink
- Report Inappropriate Content
Hi Enza, can you try this expression?:
If(RowNo()=1,
RangeSum(Before(Sum([_Amount_Fields]), 0, ColumnNo())),
Above(Last(RangeSum(Before(Sum([_Amount_Fields]), 0, ColumnNo())))) + RangeSum(Before(Sum([_Amount_Fields]), 0, ColumnNo()))
)
Edit:
To manage more than 2 years rows:
If(RowNo()=1,
RangeSum(Before(Sum(V), 0, ColumnNo())),
RangeSum(Above(Last(RangeSum(Before(Sum(V), 0, ColumnNo()))), 1, RowNo())) + RangeSum(Before(Sum(V), 0, ColumnNo()))
)
- Mark as New
- Bookmark
- Subscribe
- Mute
- Subscribe to RSS Feed
- Permalink
- Report Inappropriate Content
hi enzazaden,
i think the problem is that you are using a pivot table and switching the places of the dimensions year and month,
the problem is the rowno() function that when switching the dimension places changed her value
(if you add an expression with rowno() in it you will see that it returns unexpected values not like 1,2,3...)
i believe that the solution is to build a new table using group by and order by year and month.
may be you can provide a sample data..
Best
Ido.
- Mark as New
- Bookmark
- Subscribe
- Mute
- Subscribe to RSS Feed
- Permalink
- Report Inappropriate Content
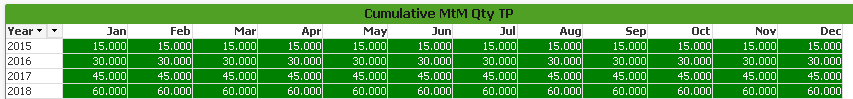
This code works! Pitfalls of the Aggr function describes the combination of two dimensions.
sum( {< Flag Rolling Months={1} >} aggr(_Amount_Fields),Field_Number,MonthYear))
Everybody thanks for helping me!