Unlock a world of possibilities! Login now and discover the exclusive benefits awaiting you.
- Qlik Community
- :
- All Forums
- :
- QlikView
- :
- Multi Dimensional Bar Chart
- Subscribe to RSS Feed
- Mark Topic as New
- Mark Topic as Read
- Float this Topic for Current User
- Bookmark
- Subscribe
- Mute
- Printer Friendly Page
- Mark as New
- Bookmark
- Subscribe
- Mute
- Subscribe to RSS Feed
- Permalink
- Report Inappropriate Content
Multi Dimensional Bar Chart
Hello Experts !
I have below data.
Data:
Load * Inline
[
Year, Country, Customer, Sales
2014, India, A, 100
2015, India, A, 120
2016, India, A, 190
2014, India, B, 140
2015, India, B, 200
2016, India, B, 290
2014, India, C, 300
2015, India, C, 200
2016, India, C, 400
2014, France, A, 450
2015, France, A, 350
2016, France, A, 600
2014, France, B, 180
2015, France, B, 360
2016, France, B, 200
2014, France, D, 450
2015, France, D, 550
2016, France, D, 650
2014, UK, E, 400
2015, UK, E, 500
2016, UK, E, 600
2014, UK, B, 350
2015, UK, B, 250
2016, UK, B, 700
2014, UK, D, 600
2015, UK, D, 500
2016, UK, D, 650
];
I want to create a bar chart with
Country, Customer and Year as Dimensions
and
SUM({<Year = {'$(=Max(Year))'}>}Sales) as an expression.
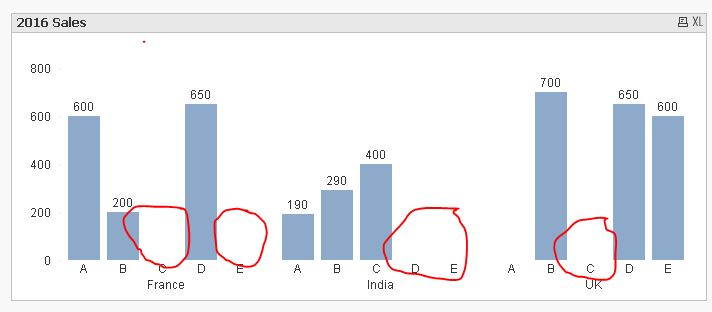
This is the image which I got after implementing above dimensions and expression.
My question is ....
as we don't have Customer C and E for France, Customer D and E for India and Customer A and C for UK... how can we remove those customers' empty bar space from above chart?
Hope I am clear on my question and explanation !
Regards,
MK
- « Previous Replies
-
- 1
- 2
- Next Replies »
- Mark as New
- Bookmark
- Subscribe
- Mute
- Subscribe to RSS Feed
- Permalink
- Report Inappropriate Content
may be workaround like this?
Remove blank space between the missing values in a bar chart
- Mark as New
- Bookmark
- Subscribe
- Mute
- Subscribe to RSS Feed
- Permalink
- Report Inappropriate Content
No simple way, but you could create a calculated dimension to concatenate the country and customer dimensions. It may not be pretty, but it will suppress the missing values.
- Mark as New
- Bookmark
- Subscribe
- Mute
- Subscribe to RSS Feed
- Permalink
- Report Inappropriate Content
Hi,
please see the attached.
Regards
André Gomes
- Mark as New
- Bookmark
- Subscribe
- Mute
- Subscribe to RSS Feed
- Permalink
- Report Inappropriate Content
I don't think it is possible to suppress missing values in a bar chart with multiple dimensions. For bar charts, it's a chart Geometry thing.
Applying Jonathan's idea to your chart, I came up with this:
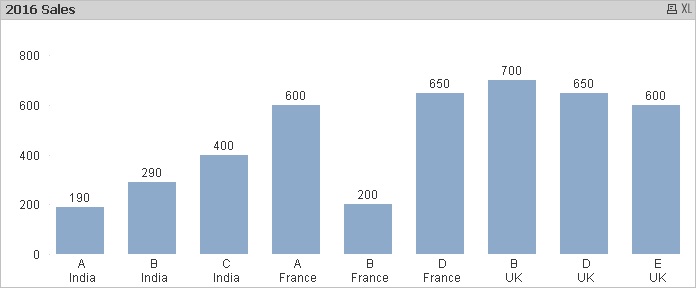
You may want to change the sort expression because it's load order based right now.
- Mark as New
- Bookmark
- Subscribe
- Mute
- Subscribe to RSS Feed
- Permalink
- Report Inappropriate Content
Perhaps a pivot table will do instead:
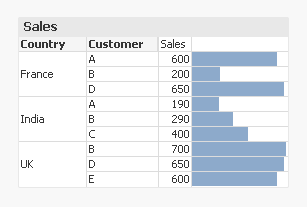
talk is cheap, supply exceeds demand
- Mark as New
- Bookmark
- Subscribe
- Mute
- Subscribe to RSS Feed
- Permalink
- Report Inappropriate Content
Hi Gysbert,
Yes, pivot table would give the exact result I am looking for but requirement is only bar chart.
Thanks for your response.
- Mark as New
- Bookmark
- Subscribe
- Mute
- Subscribe to RSS Feed
- Permalink
- Report Inappropriate Content
Thanks Peter, but this is not showing as grouping so can't use this...
- Mark as New
- Bookmark
- Subscribe
- Mute
- Subscribe to RSS Feed
- Permalink
- Report Inappropriate Content
Maybe it is nearer your aim if you used a bar-chart with a grid-mode for te second dimension or several (specialized) bar-charts (maybe within a container).
- Marcus
- Mark as New
- Bookmark
- Subscribe
- Mute
- Subscribe to RSS Feed
- Permalink
- Report Inappropriate Content
Hi Manish, maybe it's a bit crazy idea but there is some workaround to place the gaps with an invented customer and using dual to set it at the end of each country, so it ends looking as groups. No idea on how to show the country only one time per group and look nice.
I used a calculated dimension to cause selections made in Country and Cutomer fields instead of the Dim field.
I didn't really tested, maybe there is some other problems besides the creation of a non-existing customer.
- « Previous Replies
-
- 1
- 2
- Next Replies »