Unlock a world of possibilities! Login now and discover the exclusive benefits awaiting you.
- Qlik Community
- :
- All Forums
- :
- Qlik NPrinting
- :
- Pie Chart with both values and dimension in Pixelp...
- Subscribe to RSS Feed
- Mark Topic as New
- Mark Topic as Read
- Float this Topic for Current User
- Bookmark
- Subscribe
- Mute
- Printer Friendly Page
- Mark as New
- Bookmark
- Subscribe
- Mute
- Subscribe to RSS Feed
- Permalink
- Report Inappropriate Content
Pie Chart with both values and dimension in Pixelperfect NPrinting
Hi,
I am using NP 17.2.2 server and Qliksense 3.0
i am trying to build a pie chart in NPrinting which should show both values and dimension labels. I am using below in chart data
For Arguments: Client Name
For Values : Count(Ticket)
Shows like below
In above figure it only shows values, how to make it to show dimension label(Client Name) also. I know i can use image instead of this. but i need to create pie chart in NPrinting itself, not the image from qliksense. Any help on this is appreciated.
Regards
Accepted Solutions
- Mark as New
- Bookmark
- Subscribe
- Mute
- Subscribe to RSS Feed
- Permalink
- Report Inappropriate Content
Hi Supriya,
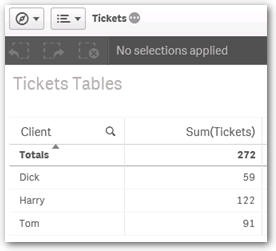
Let's say you have a straight table in your Qlik Sense app like this:
Build your pie chart in the PixelPerfect report as you normally would. Some examples linked to here: Understanding PixelPerfect Features
Then:
1. Open Chart Tasks
2. Select Series...
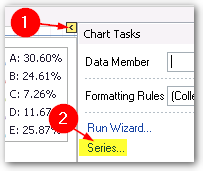
1. Select Properties
2. Scroll down to and expand Label

Scroll down to Text Pattern and enter {A}: {VP:P} - you can also use the Pattern Editor to experiment

You should get output like this:

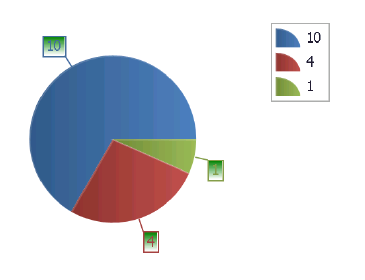
If you want Argument and Value (not Percent Value) you would use:

to get:

HTH - Daniel.
- Mark as New
- Bookmark
- Subscribe
- Mute
- Subscribe to RSS Feed
- Permalink
- Report Inappropriate Content
Hi Supriya,
Let's say you have a straight table in your Qlik Sense app like this:
Build your pie chart in the PixelPerfect report as you normally would. Some examples linked to here: Understanding PixelPerfect Features
Then:
1. Open Chart Tasks
2. Select Series...
1. Select Properties
2. Scroll down to and expand Label
Scroll down to Text Pattern and enter {A}: {VP:P} - you can also use the Pattern Editor to experiment
You should get output like this:
If you want Argument and Value (not Percent Value) you would use:
to get:
HTH - Daniel.