Unlock a world of possibilities! Login now and discover the exclusive benefits awaiting you.
- Qlik Community
- :
- All Forums
- :
- QlikView
- :
- Straight/Pivota Table
- Subscribe to RSS Feed
- Mark Topic as New
- Mark Topic as Read
- Float this Topic for Current User
- Bookmark
- Subscribe
- Mute
- Printer Friendly Page
- Mark as New
- Bookmark
- Subscribe
- Mute
- Subscribe to RSS Feed
- Permalink
- Report Inappropriate Content
Straight/Pivota Table
Hi ,
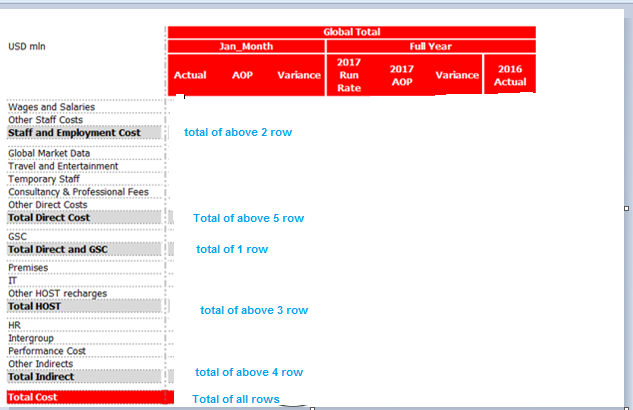
I want to create the bleow table with the same formate which is mention below, Can any one please help me how we can create the below table
Regards,
Nisha
- « Previous Replies
-
- 1
- 2
- Next Replies »
- Mark as New
- Bookmark
- Subscribe
- Mute
- Subscribe to RSS Feed
- Permalink
- Report Inappropriate Content
Hi Nisha,
I think you need to add another dimension which groups whatever dimension it is you're already using.
This will be the most straight forward way.
You could potentially do it with a valuelist dimension and pick match but that's more involved.
More than happy to advise further but a sample qvw would really be required to advise more accurately.
- Mark as New
- Bookmark
- Subscribe
- Mute
- Subscribe to RSS Feed
- Permalink
- Report Inappropriate Content
Thanks Adam,
I don't have any sample qvw, I have only that image and the rquirement.
Requirement is :
Cost Type: Plan, Actual, Forecast (Will always be two of these plus a variance)
Cost: Monthly, Year to Date, Full Year (Will only every be one of these)
Account Type: This will be at one of the 4 levels of the accounting mapping hierarchy (Likely to be levels 2, 3, or 4 only)
Grouping: This could be one of two groupings a) Site (HK, Ldn, NY, Paris, RoW) or Country, or b) Product or sub-product (They would want some of the metrics to show Site or Product side by side, i.e. compare HK, Ldn, NY, Paris, RoW.
Metrics: Current view and trending
Based on that we have to create the above table. Which are in White Color row are the Different Dimension and Which are in Gray Color are different dimension. Both Dimensions may be increase in future
- Mark as New
- Bookmark
- Subscribe
- Mute
- Subscribe to RSS Feed
- Permalink
- Report Inappropriate Content
Hi Nisha,
Sorry I can't help much here without something to work with, but I am guessing your rows are showing account types?
If so then just add a dimension which groups these into the required summary levels, then use a pivot table to generate the required totals.
- Mark as New
- Bookmark
- Subscribe
- Mute
- Subscribe to RSS Feed
- Permalink
- Report Inappropriate Content
please post sample app/ data
Preparing examples for Upload - Reduction and Data Scrambling
If a post helps to resolve your issue, please accept it as a Solution.
- Mark as New
- Bookmark
- Subscribe
- Mute
- Subscribe to RSS Feed
- Permalink
- Report Inappropriate Content
Hi ,
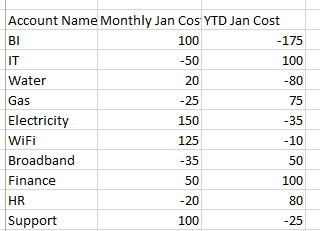
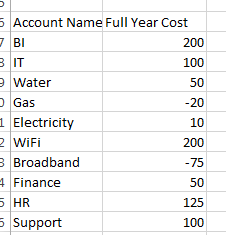
Please have a look below are the sample data tables
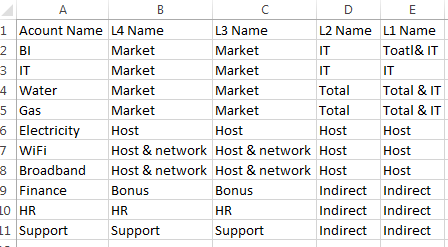
based on that we have to prepare above table. 1 to 5 row comes from Account Name and 6th row is the L1 Name etc.
- Mark as New
- Bookmark
- Subscribe
- Mute
- Subscribe to RSS Feed
- Permalink
- Report Inappropriate Content
Ok so it looks like you have all the data you need to create a pivot table here?
- Mark as New
- Bookmark
- Subscribe
- Mute
- Subscribe to RSS Feed
- Permalink
- Report Inappropriate Content
Oh if you can just copy and paste the tables from excel into a reply, then I can create an example for you.
I.e. paste the actual data, the community should then translate it into a table which I can download- not typing out those tables from an image 😉
- Mark as New
- Bookmark
- Subscribe
- Mute
- Subscribe to RSS Feed
- Permalink
- Report Inappropriate Content
How Creation of group works here?
- Mark as New
- Bookmark
- Subscribe
- Mute
- Subscribe to RSS Feed
- Permalink
- Report Inappropriate Content
Hi,
| Acount Name | L4 Name | L3 Name | L2 Name | L1 Name |
| BI | Market | Market | IT | Toatl& IT |
| IT | Market | Market | IT | IT |
| Water | Market | Market | Total | Total & IT |
| Gas | Market | Market | Total | Total & IT |
| Electricity | Host | Host | Host | Host |
| WiFi | Host & network | Host & network | Host | Host |
| Broadband | Host & network | Host & network | Host | Host |
| Finance | Bonus | Bonus | Indirect | Indirect |
| HR | HR | HR | Indirect | Indirect |
| Support | Support | Support | Indirect | Indirect |
| Account Name | Monthly Jan Cost | YTD Jan Cost |
| BI | 100 | -175 |
| IT | -50 | 100 |
| Water | 20 | -80 |
| Gas | -25 | 75 |
| Electricity | 150 | -35 |
| WiFi | 125 | -10 |
| Broadband | -35 | 50 |
| Finance | 50 | 100 |
| HR | -20 | 80 |
| Support | 100 | -25 |
| Account Name | Full Year Cost |
| BI | 200 |
| IT | 100 |
| Water | 50 |
| Gas | -20 |
| Electricity | 10 |
| WiFi | 200 |
| Broadband | -75 |
| Finance | 50 |
| HR | 125 |
| Support | 100 |
- « Previous Replies
-
- 1
- 2
- Next Replies »