Unlock a world of possibilities! Login now and discover the exclusive benefits awaiting you.
- Qlik Community
- :
- All Forums
- :
- QlikView App Dev
- :
- Cumulative count (out of selection) in qlikview ch...
- Subscribe to RSS Feed
- Mark Topic as New
- Mark Topic as Read
- Float this Topic for Current User
- Bookmark
- Subscribe
- Mute
- Printer Friendly Page
The message you are trying to access is permanently deleted.
- Mark as New
- Bookmark
- Subscribe
- Mute
- Subscribe to RSS Feed
- Permalink
- Report Inappropriate Content
Cumulative count (out of selection) in qlikview chart expression
Hello,
I would like to count materials from the beginning (January 2010) even if I select ONLY year 2017.
In other words, if I select ONLY 2017’s month, I would like to have:
- For January 2017: Cumulative Count of materials From January 2010 To January 2017.
- For February 2017: Cumulative Count of materials From January 2010 To February 2017.
- For March 2017: Cumulative Count of materials From January 2010 To March 2017.
PFA file for more details.
Thx in advance for your help.
Ricky.
- « Previous Replies
-
- 1
- 2
- Next Replies »
Accepted Solutions
- Mark as New
- Bookmark
- Subscribe
- Mute
- Subscribe to RSS Feed
- Permalink
- Report Inappropriate Content
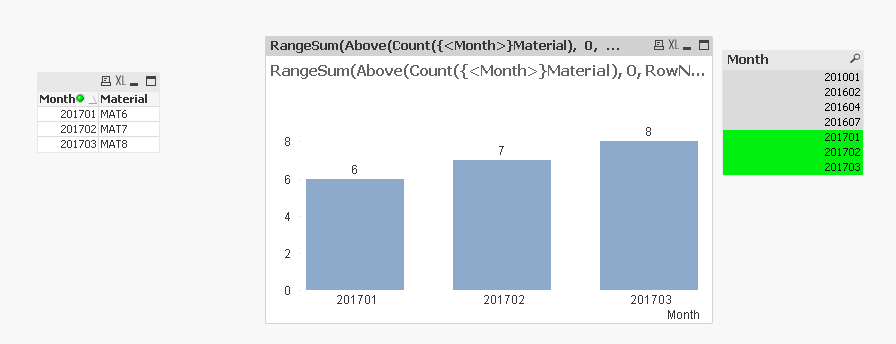
May be this
RangeSum(Above(Count({<Month>}Material), 0, RowNo())) * Avg(1)
- Mark as New
- Bookmark
- Subscribe
- Mute
- Subscribe to RSS Feed
- Permalink
- Report Inappropriate Content
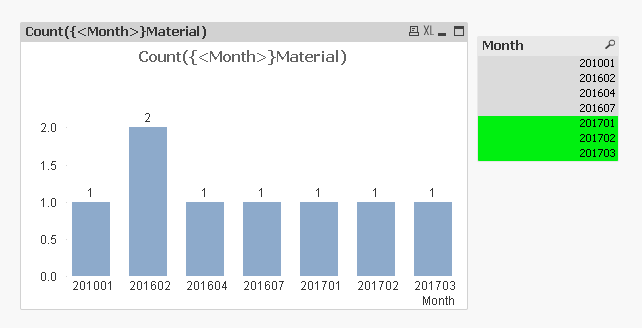
May be this
Count({<Month>}Material)
- Mark as New
- Bookmark
- Subscribe
- Mute
- Subscribe to RSS Feed
- Permalink
- Report Inappropriate Content
Thx Sunny,
But I would like to show just selected month in the chart (from jan to march 2017 in my case).
I got the message about duplicated threads.
Ricky.
- Mark as New
- Bookmark
- Subscribe
- Mute
- Subscribe to RSS Feed
- Permalink
- Report Inappropriate Content
May be this
RangeSum(Above(Count({<Month>}Material), 0, RowNo())) * Avg(1)
- Mark as New
- Bookmark
- Subscribe
- Mute
- Subscribe to RSS Feed
- Permalink
- Report Inappropriate Content
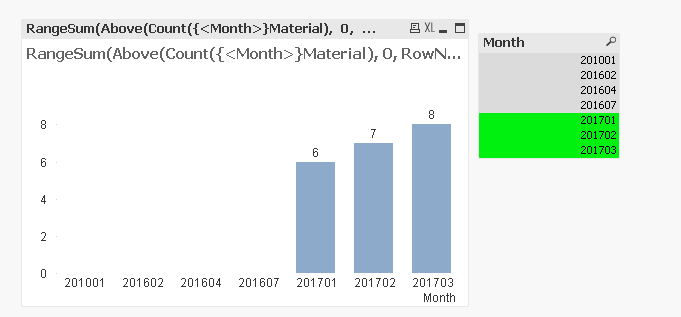
Thx a lot Sunny,
Can you just tell me how to hide ther moths in the chart (when I try your solution, I m still seeing the other months (before 2017) with 0 value).
Ricky.
- Mark as New
- Bookmark
- Subscribe
- Mute
- Subscribe to RSS Feed
- Permalink
- Report Inappropriate Content
Can you show the image of what you are seeing?
- Mark as New
- Bookmark
- Subscribe
- Mute
- Subscribe to RSS Feed
- Permalink
- Report Inappropriate Content
Here you are:
- Mark as New
- Bookmark
- Subscribe
- Mute
- Subscribe to RSS Feed
- Permalink
- Report Inappropriate Content
Can you check if you have unchecked 'Suppress Zero Values' on the presentation tab? Make sure it is checked
- Mark as New
- Bookmark
- Subscribe
- Mute
- Subscribe to RSS Feed
- Permalink
- Report Inappropriate Content
Yes, I have checked both options (checked and unchecked), the resul was same.
- Mark as New
- Bookmark
- Subscribe
- Mute
- Subscribe to RSS Feed
- Permalink
- Report Inappropriate Content
What version of QlikView are you using? This might be a version related issue? Did you try to open the app I attached and you saw the same issue?
- « Previous Replies
-
- 1
- 2
- Next Replies »