Unlock a world of possibilities! Login now and discover the exclusive benefits awaiting you.
- Qlik Community
- :
- All Forums
- :
- QlikView
- :
- Missing values on time dimension
- Subscribe to RSS Feed
- Mark Topic as New
- Mark Topic as Read
- Float this Topic for Current User
- Bookmark
- Subscribe
- Mute
- Printer Friendly Page
- Mark as New
- Bookmark
- Subscribe
- Mute
- Subscribe to RSS Feed
- Permalink
- Report Inappropriate Content
Missing values on time dimension
Hey,
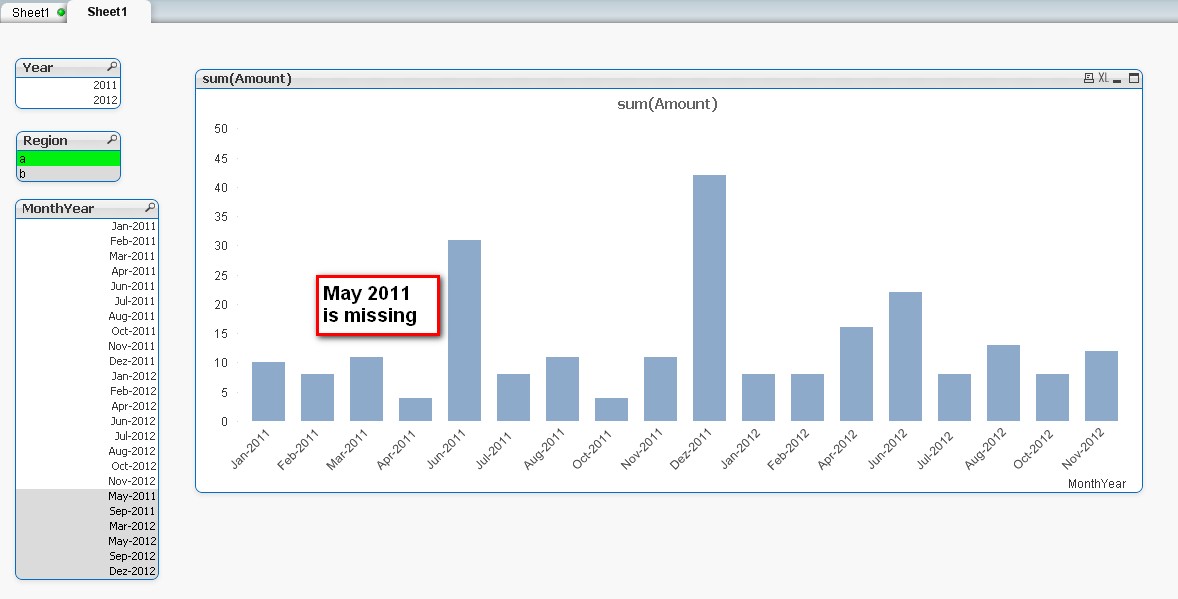
We want to show sales in a bar chart diagram with monthly intervals on the X-axis. Therefore we implemented a master calendar which allows generally to display all months of a year, even when a specific month has no values (having unchecked "Suppress Zero-Values" in the Presentation tab).
Nevertheless, when we select a region which doesn't have values for a certain month, this month isn't shown anymore (e.g. May 2011 for Region "a").
Thank you for your help!
- « Previous Replies
- Next Replies »
Accepted Solutions
- Mark as New
- Bookmark
- Subscribe
- Mute
- Subscribe to RSS Feed
- Permalink
- Report Inappropriate Content
I'll admit to only skimming the page and not looking at the examples. But attached is one fairly-complicated way to handle it primarily with the data model. Complexity is the only practical drawback I'm aware of, and I've used this approach in one of our real applications, where it has been working just fine. Performance should be high, no new rows in the original table (Edit: requires new rows in the original table), charts don't display missing dates unless you tell them to. I can't take credit - Michael Solomovich gave me the necessary hints to work this out when I was having this same problem.
Practical cases may be simpler than this example. The calendar generation is much more complicated than in my typical applications due to breaking a day into three turns and basing the calendar on my data (where in a typical appliation, I load data based on the desired calendar). I think the things to really look at are the generation of the DateTurnKey in the original table, and the creation of the DateLink table.
It may be confusing why I lock ShowZeroPoints?='N', and then use set analysis to sum({<ShowZeroPoints?={'Y'}>} Sales). It might seem a bit contradictory, and a giant waste of effort. The idea is that most charts don't want anything special. They just want our original data displayed the way QlikView always displays it. Locking the field to N provides exactly that, and means that normal charts don't need to use any set analysis to exclude our extra data. It'll be excluded automatically by the locked field. Only charts that need to show the zero points need to use set analysis, and only to say that they want to show zero points. I have no other charts in the example, so it's a complete waste here, but I think it's an important part of the example if you're trying to apply it to real world cases.
- Mark as New
- Bookmark
- Subscribe
- Mute
- Subscribe to RSS Feed
- Permalink
- Report Inappropriate Content
You would not see May 2011 if there is no resulting data attached to it, in the above instance I am assuming your expression is 0 for that month, ensure you have unchecked the "supress null" tickbox
- Mark as New
- Bookmark
- Subscribe
- Mute
- Subscribe to RSS Feed
- Permalink
- Report Inappropriate Content
Deselecting "supress null" will work only when no selections are made. Once region a is selected then may 2011 will be filtered out because there is no data with region a and therefore will not be displayed in the chart.
You can try one of the following:
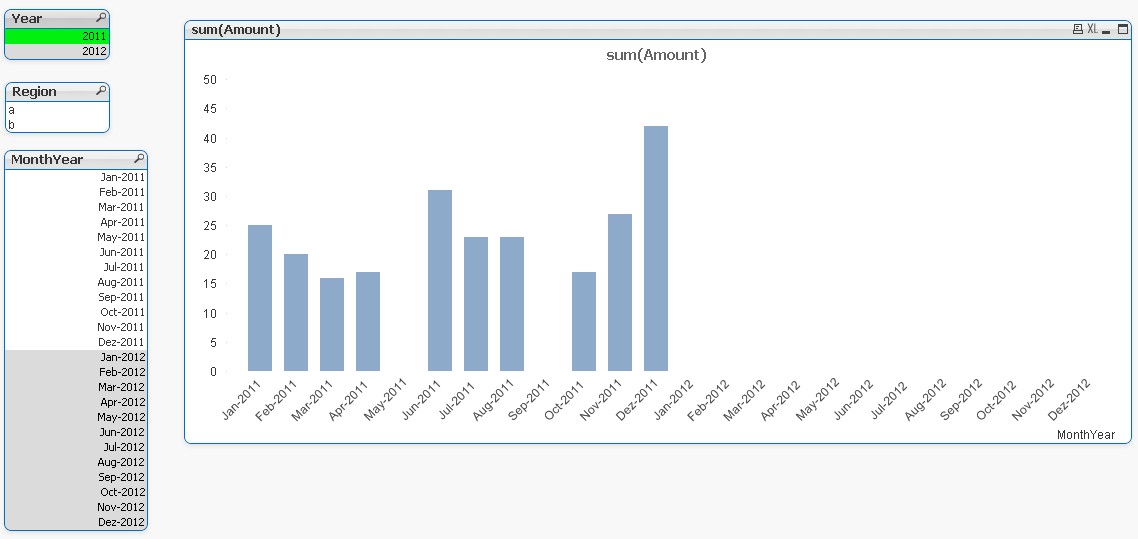
1) Select show all values. All dates will be displayed regardless of the selection.
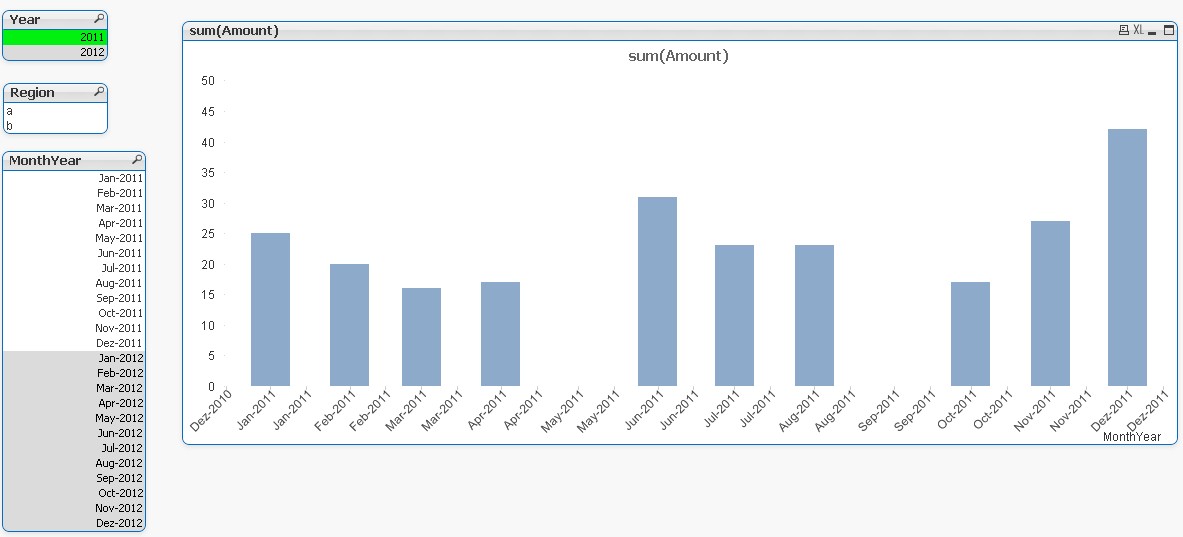
2) Add a month start date to the master calendar, change the chart to use the month start date as the dimension, change the x-axis to be continous, and format the axis to MMM-YYYY. You will need to fiddle with the min, max, and step values on the x-axis to make it display correctly.
3) Add rows to the data table to ensure that there is a data for every month. You should also have a data type column to identify these fake rows. Use nulls or 0 (it will depend on your calculations) for the attribute columns of the fake rows. Change the expressons in your chart to always include these fake rows.
- Mark as New
- Bookmark
- Subscribe
- Mute
- Subscribe to RSS Feed
- Permalink
- Report Inappropriate Content
Thanks vhuynh for your suggestions!
ad 1) "Show all values" is almost the solution we are looking for. There's just one problem: when we select year 2011 then we also see the months of 2012 on the X-axis.
That's a disadvantage when having several years. Is there a way to just show the selected years (e.g. in tab "Dimension limits")?
ad 2) We've already tried this option but can't figure out how to set the step values correctly (at the moment intervals depend on size of the bar chart)
ad 3) Our attachment above is just an example. Normally we have much more selection options and more data shown in various years. Once a selecion option (e.g. region, dealer, ...) is selected the other dates are filtered out. How to write in the script that it automatically recognizes the dates missing and sets a null for the selected options, so that all the dates are shown on the x-axis?
Anyway we would prefer a solution in the layout rather than the script.
Thanks!
- Mark as New
- Bookmark
- Subscribe
- Mute
- Subscribe to RSS Feed
- Permalink
- Report Inappropriate Content
Florian Pennetzdorfer wrote:
Thanks vhuynh for your suggestions!
ad 1) "Show all values" is almost the solution we are looking for. There's just one problem: when we select year 2011 then we also see the months of 2012 on the X-axis.
That's a disadvantage when having several years. Is there a way to just show the selected years (e.g. in tab "Dimension limits")?

I'm also interested in this issue. Does anyone have an advice for it?
thanks!
- Mark as New
- Bookmark
- Subscribe
- Mute
- Subscribe to RSS Feed
- Permalink
- Report Inappropriate Content
The problem is that when you select your region there is no data associated with May 2011.
Not only Amount but also even Dates.
You can add that data in the script.
All missed months for each product with null() Amount.
I think your real data is sufficiently complex that there are more values than nulls.
- Mark as New
- Bookmark
- Subscribe
- Mute
- Subscribe to RSS Feed
- Permalink
- Report Inappropriate Content
Sure it sounds like a fair option.
But code-wise, how would that look?
Where YYYYMM IsNull .... ??
And I should also limit the creation of YYYYMM, as I wouldn't like to have entries dating back at French Revolution times!
- Mark as New
- Bookmark
- Subscribe
- Mute
- Subscribe to RSS Feed
- Permalink
- Report Inappropriate Content
Why?
You want see the nulls on chart.
To see them, they must be there.
So you have to create them in script or synthetically.
If you want to see nulls 'back at French Revolution times' you have to create them somehow.
- Mark as New
- Bookmark
- Subscribe
- Mute
- Subscribe to RSS Feed
- Permalink
- Report Inappropriate Content
whiteline wrote:
Why?
You want see the nulls on chart.
To see them, they must be there.
Yep, already agreed on that!
So you have to create them in script or synthetically.
If you want to see nulls 'back at French Revolution times' you have to create them somehow.
That I understood; could you please point out how? I'm a beginner at scripting and I cannot find a creative yet functional way to do this...thank you!
- Mark as New
- Bookmark
- Subscribe
- Mute
- Subscribe to RSS Feed
- Permalink
- Report Inappropriate Content
Something like this:
FullRegionsPeriods:
LOAD distinct
Region
Resident FactTable;
Preiods:
LOAD distinct
MonthYear
Resident FactTable;
left join(Regions)
LOAD * RESIDENT Preiods;
drop table Preiods;
- « Previous Replies
- Next Replies »