Unlock a world of possibilities! Login now and discover the exclusive benefits awaiting you.
- Qlik Community
- :
- Blogs
- :
- Technical
- :
- Design
- :
- Performance of Conditional Aggregations
- Subscribe to RSS Feed
- Mark as New
- Mark as Read
- Bookmark
- Subscribe
- Printer Friendly Page
- Report Inappropriate Content
In my previous post I compared different methods for making Conditional Aggregations. In it, I claimed that Set Analysis often is faster than other methods, like an If()-function or a multiplication with a flag.
Also, in a recent discussion on the forum performance benefits of the different methods are discussed, and the multiplication method is favored by some.
So I decided to make my own test.
The main conclusion from my test is that Set Analysis is by far the most performant way to make a conditional aggregation – in the cases when you need performance. The chart below shows the average chart calculation time for the five different ways to make a conditional aggregation in a situation where you have a large amount of data.
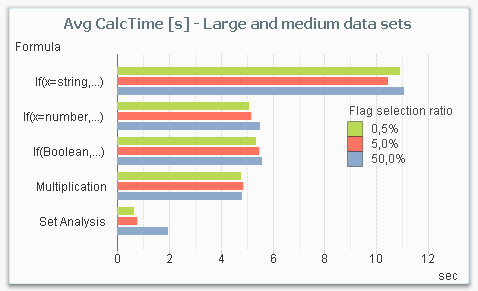
From this chart, you can draw several conclusions:
- Set Analysis is the fastest alternative for large data sets.
- Set Analysis is relatively better if the selection ratio is small (the sub-set of data that the condition picks out), since the following aggregation runs over a much smaller number of rows. This is in sharp contrast to the other methods where the selection ratio hardly affects the result.
- The three methods in the middle (numeric comparison as condition, Boolean flag as condition and multiplication) are roughly the same from a performance perspective.
- An If()-function with a string comparison is by far the worst choice.
But it is not a clear-cut case: If you instead make the same measurements with a smaller data set, Set Analysis is not the most efficient method. The chart below shows the result for a smaller data amount. Note that even though the data amount still is considerable (1M records), it is small enough for all response times to be under a second, whereas they in most cases are an order of magnitude larger in the above graph.
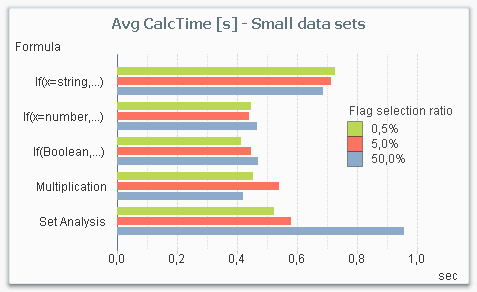
The reason is that there is an overhead in Set Analysis, that has to be performed independently of whether the data amount is large or not. So for small data amounts, the performance gain in the aggregation is not large enough to cover the overhead.
The bottom line is that Set Analysis is the method you should use for large data amounts. For smaller data amounts, it doesn’t really matter which method you choose: They are all fast enough.
About the test:
The test was made on my dual-core laptop with 16GB of memory. The data model consisted of three tables; one fact table and two dimension tables. The fact table contained 100 million records.
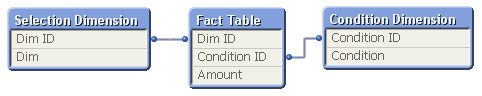
The calculation time of a pivot table with the field Dim as dimension and the sum of Amount as expression was measured, using the different ways to code the condition. The field Condition was used as flag in the condition.
The measurement was repeated for different user selections in Dim (99M records, 10M records and 1M records), for different selection ratios in the condition (0.5%, 5% and 50%), and for different cardinality in the Condition Dimension (1000 records, 1M records).
The measurements were made starting with a cleared cache, then making a series of different selections in the field Dim of which the last three were recorded. This way the cache was populated with basic calculations and indexes, but not with the specific chart calculation.
Further reading related to this topic:
- « Previous
-
- 1
- 2
- Next »
You must be a registered user to add a comment. If you've already registered, sign in. Otherwise, register and sign in.