Unlock a world of possibilities! Login now and discover the exclusive benefits awaiting you.
- Subscribe to RSS Feed
- Mark as New
- Mark as Read
- Bookmark
- Subscribe
- Printer Friendly Page
- Report Inappropriate Content
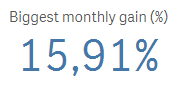
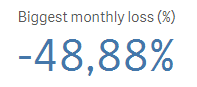
I ran into an interesting dilemma last week when trying to create a measure for a KPI object in Qlik Sense. Let me set the scene. I was working on an app that tracks organization members and activities. The requirement was to look at the number of members in the organization over time and identify the largest and lowest monthly gain and loss. I was able to build the table below to see how the number of members varied over time and where the largest gain and loss were. The largest gain was from Nov 2015 to Dec 2015 with a 15.91% member increase. The largest loss was Sept 2015 to Oct 2015 with -48.88% member decrease.
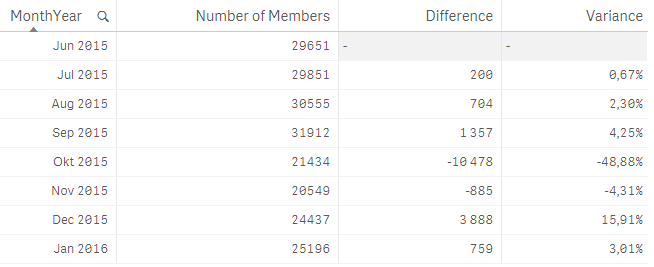
The measures for this table looked like this:
Number of Members – count the number of distinct members

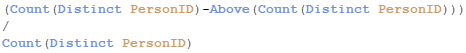
Difference – count the difference between this month and the previous month using the Above() function to capture the previous month’s number of members

Variance – show the difference as a percentage
Now here is where my dilemma began. I needed to capture the percentage and number of the gains and losses in a KPI object and I was not sure how to do that. I knew there had to be a way to do it in Qlik Sense so I turned to my colleague Arturo Munoz who enlightened me to the fact that when I use the Aggr() function, it creates a temporary staged result set, like a table, similar to what I was doing in the table above. So I tried this out in a KPI object using the Variance expressions above and aggregating the results by MonthYear. Since I wanted the largest gain and loss, I also used the Max() and Min() functions. Here is what my KPI measures looked like when I was done:
Largest Gain %

Largest Loss %

I was able to use the Above() function in my KPI measure to get the variance and then I aggregated the result by MonthYear and captured the maximum and minimum variance. I was able to apply this to my app for other KPIs as well. It was brilliant. I never thought that I could use the Above() function outside of a Table object but I was very happy to find out I was wrong. In order for the Aggr() function to work as I expected, I needed to make sure the MonthYear field was sorted properly in ascending order so I handled this in my script. Note that if the MonthYear field was not in ascending order, the Above() function may not always return the previous month thus returning the wrong results.
Henric Cronstrom has blogged about the Aggr() function in his blog Aggregations and Function Classes as has Adam Bellerby in his AGGR... blog. The Aggr() function can be quite helpful and while I have gotten use to using it, I realized that there are still so many other ways it can be used. I hope you find this way of using it as helpful as I did.
Thanks,
Jennell
You must be a registered user to add a comment. If you've already registered, sign in. Otherwise, register and sign in.