Unlock a world of possibilities! Login now and discover the exclusive benefits awaiting you.
- Qlik Community
- :
- All Forums
- :
- Qlik NPrinting
- :
- Re: Nprinting Report display
- Subscribe to RSS Feed
- Mark Topic as New
- Mark Topic as Read
- Float this Topic for Current User
- Bookmark
- Subscribe
- Mute
- Printer Friendly Page
- Mark as New
- Bookmark
- Subscribe
- Mute
- Subscribe to RSS Feed
- Permalink
- Report Inappropriate Content
Nprinting Report display
Hi,
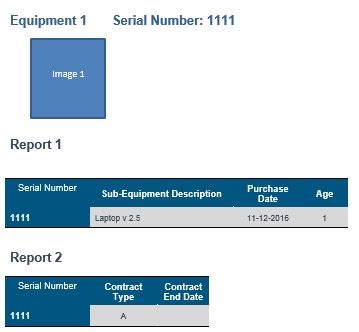
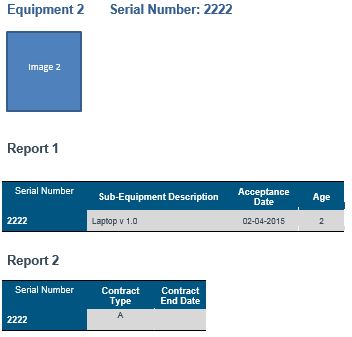
I have written the macros to generate below reports in Microsoft Word (Please refer Microsoft Word Report generated through Macros). We are using same Qlikview chart to display Report 1 of Page 1 and Report 1 of Page 2. And likewise we are using same Qlikview chart to display report 2 of Page 1 and report 2 Page 2. To achieve this we are using loops in the macros. We are also displaying image of the Equipment.
I want to replace this by Nprinting. How can I achieve this in Nprinting. Can you please guide me or provide hint on this.
We are using below Qlikview chart to display Report 1 in MS word (Refer Report 1 of Page 1 and Report 1 of Page 2) :
Serial Number | Sub-Equipment Description | Purchase Date | Age |
1111 | Laptop v 2.5 | 11-12-2016 | 1 |
2222 | Laptop v 1.0 | 02-04-2015 | 2 |
We are using below Qlikview chart to display Report 2 in MS word (Refer Report 2 of Page 1 and Report 2 of Page 2) :
Serial Number | Contract Type | Contract End Date |
1111 | A | |
2222 | A |
Microsoft Word Report generated through Macros:
Page 1 :
-----------------------------------------------------------------------------------------------------------------------------------------------------------------------
Page 2 :
Thanks
Sagar
- Mark as New
- Bookmark
- Subscribe
- Mute
- Subscribe to RSS Feed
- Permalink
- Report Inappropriate Content
Hi,
Refer this QlikView NPrinting 16 Tutorials - Word Reports
and NPrinting 16 Training & Installation/Upgrade Information
Vikas
If the issue is solved please mark the answer with Accept as Solution & like it.
If you want to go quickly, go alone. If you want to go far, go together.
- Mark as New
- Bookmark
- Subscribe
- Mute
- Subscribe to RSS Feed
- Permalink
- Report Inappropriate Content
Check the level concept in Npriting to achieve this
check this thread
What is the function of levels in Nprinting?
How to Create Excel Reports with Nested Levels and Subtotals
- Mark as New
- Bookmark
- Subscribe
- Mute
- Subscribe to RSS Feed
- Permalink
- Report Inappropriate Content
Can I use the levels in Microsoft word. Because I do not get any document related to this.
- Mark as New
- Bookmark
- Subscribe
- Mute
- Subscribe to RSS Feed
- Permalink
- Report Inappropriate Content
- Mark as New
- Bookmark
- Subscribe
- Mute
- Subscribe to RSS Feed
- Permalink
- Report Inappropriate Content
Hi ,
How can I break the page/report in Word.
- Mark as New
- Bookmark
- Subscribe
- Mute
- Subscribe to RSS Feed
- Permalink
- Report Inappropriate Content
I think it will happen by default rite ? did you try