Unlock a world of possibilities! Login now and discover the exclusive benefits awaiting you.
- Qlik Community
- :
- Forums
- :
- Analytics & AI
- :
- Products & Topics
- :
- Visualization and Usability
- :
- Re: Row percent for subtotals in pivot table Qlik ...
- Subscribe to RSS Feed
- Mark Topic as New
- Mark Topic as Read
- Float this Topic for Current User
- Bookmark
- Subscribe
- Mute
- Printer Friendly Page
- Mark as New
- Bookmark
- Subscribe
- Mute
- Subscribe to RSS Feed
- Permalink
- Report Inappropriate Content
Row percent for subtotals in pivot table Qlik Sense
Hi!
In a Qlik Sense pivot table I want to show row percentages adding to 100 % for each row/subgroup.
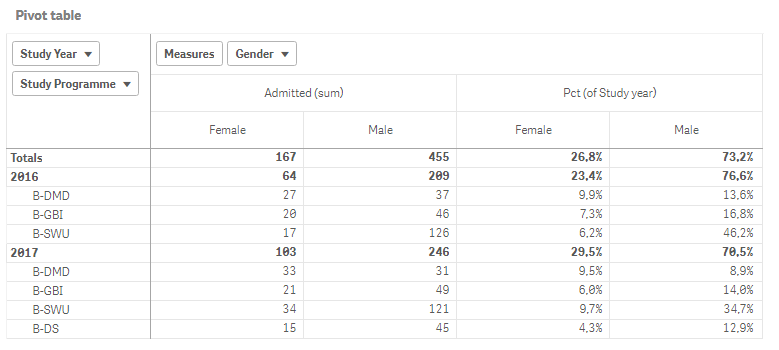
Here's my pivot table:

The row percent for each year is correct. It sums to 100%.
But I also need a row total of 100% for each Study Programme. That is: in row no 3 (the B-DMD Study Programme) the percent of Females should be 27 / (27+37) = 42,2 % and not the 9,9%.
The percent is calculated with this expression:
SUM(ADMITTED)
/
SUM(total <STUDYYEAR> ADMITTED)
Any ideas?
Best regards
Accepted Solutions
- Mark as New
- Bookmark
- Subscribe
- Mute
- Subscribe to RSS Feed
- Permalink
- Report Inappropriate Content
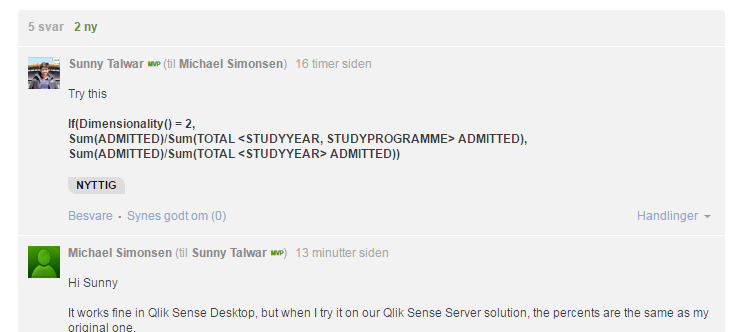
Try this
If(Dimensionality() = 2,
Sum(ADMITTED)/Sum(TOTAL <STUDYYEAR, STUDYPROGRAMME> ADMITTED),
Sum(ADMITTED)/Sum(TOTAL <STUDYYEAR> ADMITTED))
- Mark as New
- Bookmark
- Subscribe
- Mute
- Subscribe to RSS Feed
- Permalink
- Report Inappropriate Content
Try this
If(Dimensionality() = 2,
Sum(ADMITTED)/Sum(TOTAL <STUDYYEAR, STUDYPROGRAMME> ADMITTED),
Sum(ADMITTED)/Sum(TOTAL <STUDYYEAR> ADMITTED))
- Mark as New
- Bookmark
- Subscribe
- Mute
- Subscribe to RSS Feed
- Permalink
- Report Inappropriate Content
Hi Sunny
It works fine in Qlik Sense Desktop, but when I try it on our Qlik Sense Server solution, the percents are the same as my original one.
Could there be any differences on how the Dimensionality() function works i Desktop and Server? Borth are june 2017 release.
Regards
Michael
- Mark as New
- Bookmark
- Subscribe
- Mute
- Subscribe to RSS Feed
- Permalink
- Report Inappropriate Content
Hi Sunny
Sorry about the former question - my bad. I got it to work fine on Server.
Thanks!
Michael
- Mark as New
- Bookmark
- Subscribe
- Mute
- Subscribe to RSS Feed
- Permalink
- Report Inappropriate Content
I don't see any reasons for differences... can you check if you get different values for Dimensionality() function when you create it as an expression? also do you have more than 2 dimensions here?
- Mark as New
- Bookmark
- Subscribe
- Mute
- Subscribe to RSS Feed
- Permalink
- Report Inappropriate Content
Awesome!!! Please close the thread by marking correct response
Qlik Community Tip: Marking Replies as Correct or Helpful
Best,
Sunny
- Mark as New
- Bookmark
- Subscribe
- Mute
- Subscribe to RSS Feed
- Permalink
- Report Inappropriate Content
I would love to make it a correct answer, but there is no Correct Answer button
in the answer ??

- Mark as New
- Bookmark
- Subscribe
- Mute
- Subscribe to RSS Feed
- Permalink
- Report Inappropriate Content
Someone fixed it. Thanks!