Unlock a world of possibilities! Login now and discover the exclusive benefits awaiting you.
- Qlik Community
- :
- All Forums
- :
- QlikView App Dev
- :
- How to create a Gantt chart using a Pivot table
- Subscribe to RSS Feed
- Mark Topic as New
- Mark Topic as Read
- Float this Topic for Current User
- Bookmark
- Subscribe
- Mute
- Printer Friendly Page
- Mark as New
- Bookmark
- Subscribe
- Mute
- Subscribe to RSS Feed
- Permalink
- Report Inappropriate Content
How to create a Gantt chart using a Pivot table
Hi,
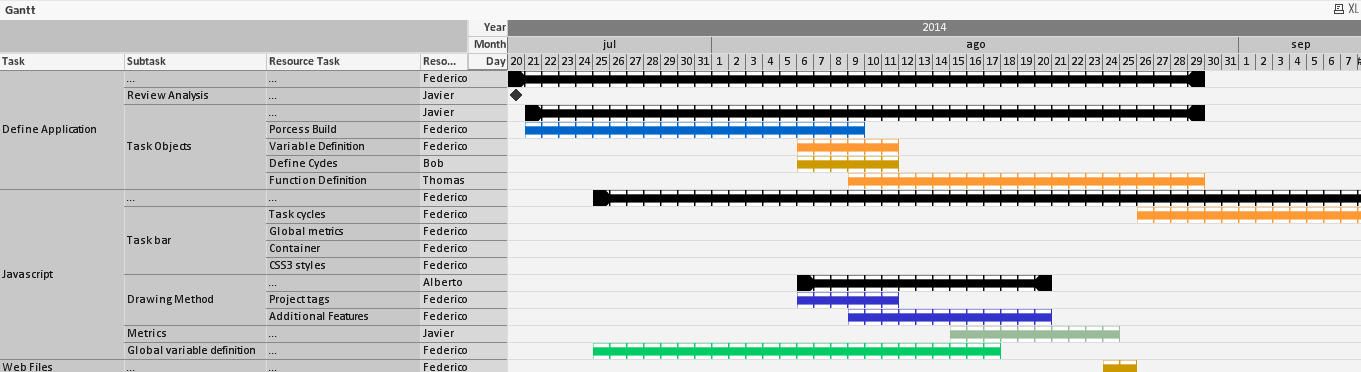
I just wanted to share another example on how to create a Gantt chart in QlikView. To do this we can use some of QlikView's available resources as an alternative to the use of Extension Objects. In this case I have used a Pivot Table.
To create this chart I’ve used some example data (Excel file) that can be found on the zip file attached bellow. That file has several fields, enough to identify the tasks of a Project (such as ID, Start, End…).

In order to be able to pick the desired dates a master calendar has been used. Also, the IntervalMatch functionality has proved very useful by generating the dates between the start and end of the different tasks that the project has.
The Hierarchy functionality in the load script generates the different task levels.
There is something peculiar about the data I am using (Excel file). Colors for each task are specified in Hexadecimal format. So during the load script I converted them to RGB colors (color code used by QlikView).
After the data model has been completed a Pivot Table can be used to represent my Gantt chart. To make the chart stable, on the pivot table properties we need to uncheck the "allow pivoting" option. As dimensions we will have each task level, years months and days.
The expression is a bit different. First of all, I it's represented as an Image. That image is a png file (included in the zip file) with transparency that will let us see the background color of each cell.
The expression is as follows:
if(End=Start,'◆',
if(date(DateID)=date(Today()),'gantt_part_today.png',
if(Start = DateID and Group = 1,'gantt_part_end_l.png',
if(End = DateID and Group = 1,'gantt_part_end_r.png',
if(End-DateID+1>0,'gantt_part_mid.png',
if(date(DateID)=date(Today()),'gantt_part_today.png'))))))
The bacground color for each cell, is already stored in the data. So we just need to use it as a background color for our expression. In this case, if it is not a milestone, use the color value:
if(Mile =0, RGBColor)
That's all. The Pivot table now can be used as Gantt chart. I hope you find this example useful.
- « Previous Replies
-
- 1
- 2
- Next Replies »
- Mark as New
- Bookmark
- Subscribe
- Mute
- Subscribe to RSS Feed
- Permalink
- Report Inappropriate Content
omr,
Looks nice. You can create this as document and publish in community, helpful to all of them.
To upload: http://community.qlik.com/document/create.jspa
Regards.
Siva
- Mark as New
- Bookmark
- Subscribe
- Mute
- Subscribe to RSS Feed
- Permalink
- Report Inappropriate Content
Awesome. You saved my day!
- Mark as New
- Bookmark
- Subscribe
- Mute
- Subscribe to RSS Feed
- Permalink
- Report Inappropriate Content
I created the chart and everything looks good. But when I view the chart in web view it is getting messed up a bit. Will the same problem exist if the qvw is published to the server and accessed through access point?
- Mark as New
- Bookmark
- Subscribe
- Mute
- Subscribe to RSS Feed
- Permalink
- Report Inappropriate Content
Hey Hose
This is great work. I had developed an extension for this, but this eliminates the need for using that. I will put a link from my posting to here, as this is a great option.
I assume that you could set the level of time granularity as detailed or high level as you wish, just by adding the necessary fields from the master calendar. Is that correct?
Regards
Lee
- Mark as New
- Bookmark
- Subscribe
- Mute
- Subscribe to RSS Feed
- Permalink
- Report Inappropriate Content
Thanks!
Yes you could. There is some sample data on the attached file. If you wanted to add more detail to the timeline (such as hour and minutes), that information whould need to be on the source data and on the master calendar.
- Mark as New
- Bookmark
- Subscribe
- Mute
- Subscribe to RSS Feed
- Permalink
- Report Inappropriate Content
Hi,
You can also find this post as a documment here: How to create a Gantt chart using a Pivot table
- Mark as New
- Bookmark
- Subscribe
- Mute
- Subscribe to RSS Feed
- Permalink
- Report Inappropriate Content
Hi Jose,
When I try to reload it asked for "Field not found Name2" and I can't find out how the name2, name3 come from in the script. Can you help please?
Thanks,
Allan
- Mark as New
- Bookmark
- Subscribe
- Mute
- Subscribe to RSS Feed
- Permalink
- Report Inappropriate Content
Hi,
Just to check, did you place the file called ProjectExample.xlsx (included on the zip) next to the QlikView document?
The error you are getting could be because the first table on the load script _tmpProject, does not have valid data.
Please, make sure that the excel file containing the data is reachable by the QlikView App and that the field Name has values.
If you unzip all the contents of the zip file on a folder, the app should reload correctly (as all the paths are relative).
- Mark as New
- Bookmark
- Subscribe
- Mute
- Subscribe to RSS Feed
- Permalink
- Report Inappropriate Content
Thanks Jose.
Yes the xlsx is in the same folder, and I find the root cause, I updated the table set all parent 0 as no parent/child relation among tasks in my case, which causing name2 and name3 not valid. I comment out name2 and name3 in the script and it's working great.
Appreciated for your help and the excellent sample.
Allan
- « Previous Replies
-
- 1
- 2
- Next Replies »