Unlock a world of possibilities! Login now and discover the exclusive benefits awaiting you.
- Qlik Community
- :
- All Forums
- :
- QlikView App Dev
- :
- Re: Stacked Bar Chart
- Subscribe to RSS Feed
- Mark Topic as New
- Mark Topic as Read
- Float this Topic for Current User
- Bookmark
- Subscribe
- Mute
- Printer Friendly Page
- Mark as New
- Bookmark
- Subscribe
- Mute
- Subscribe to RSS Feed
- Permalink
- Report Inappropriate Content
Stacked Bar Chart
Hi,
Is it possible to create a stacked bar chart alongwith a line chart? The chart has two dimensions and two expressions?
On the x axis we need to show Months
On the y axis, sum(FieldA) for different values of field B.- This should be in the form of a stacked bar chart.
sum(FieldA)- Line chart.(This would just be the totla sum for different months)
- Mark as New
- Bookmark
- Subscribe
- Mute
- Subscribe to RSS Feed
- Permalink
- Report Inappropriate Content
Looks like same question you asked last week....
- Mark as New
- Bookmark
- Subscribe
- Mute
- Subscribe to RSS Feed
- Permalink
- Report Inappropriate Content
I want something like that. As shown in the image, the X axis has months whereas the Y values has some values. The stacks in the bar should be based on a field B i.e we have to show for each value of field B what is the Y value. The line chart should display the totla value for each month. Creating just the stacked bar chart without the line part works fine, but if i try to include the line chart, then the stacks on the bar disappear and the chart looks clumsy.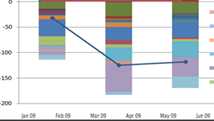
- Mark as New
- Bookmark
- Subscribe
- Mute
- Subscribe to RSS Feed
- Permalink
- Report Inappropriate Content
Kindly provide sample apps or sample data...
- Mark as New
- Bookmark
- Subscribe
- Mute
- Subscribe to RSS Feed
- Permalink
- Report Inappropriate Content
Kindly refer the attched qvw. I wish to add another line chart here which depicts the sum of all values for a particular month.