Unlock a world of possibilities! Login now and discover the exclusive benefits awaiting you.
- Qlik Community
- :
- All Forums
- :
- QlikView App Dev
- :
- Trend line?
- Subscribe to RSS Feed
- Mark Topic as New
- Mark Topic as Read
- Float this Topic for Current User
- Bookmark
- Subscribe
- Mute
- Printer Friendly Page
- Mark as New
- Bookmark
- Subscribe
- Mute
- Subscribe to RSS Feed
- Permalink
- Report Inappropriate Content
Trend line?
Hi,
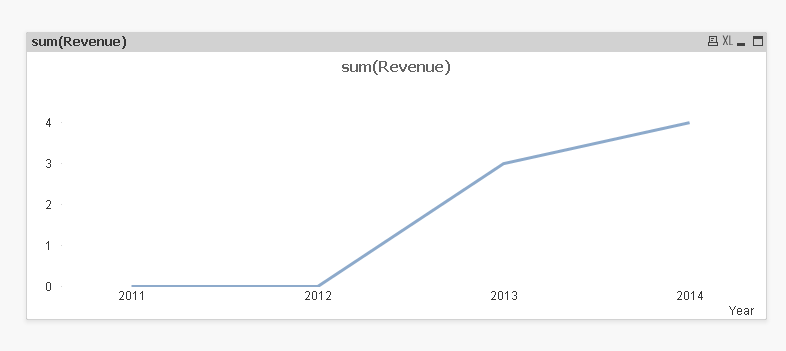
I have a requirement where i need to show the trend line of Revenue over the years.
Ex:
year, Rev
2011,0
2012,0
2013,2
2014,4
when i had this data on chart, trend line only shows for 2013 and 2014, but i want it to show from 2011 to 2014 i.ee line from 0 to 4.
Is it possible?
Thanks
- « Previous Replies
-
- 1
- 2
- Next Replies »
Accepted Solutions
- Mark as New
- Bookmark
- Subscribe
- Mute
- Subscribe to RSS Feed
- Permalink
- Report Inappropriate Content
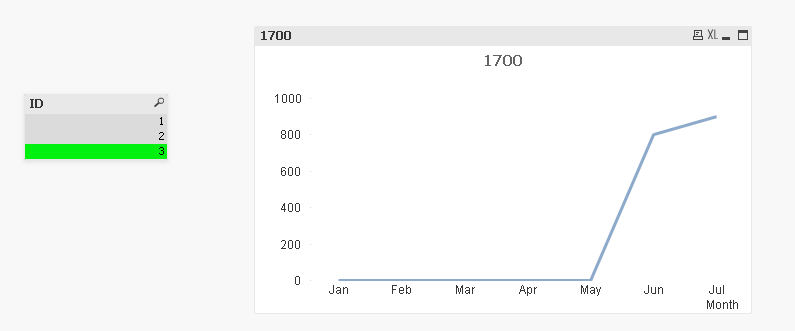
Used a CrossTable load to first fix the data in a structure which can be used easily:
Table:
load * inline [
ID, Jan,Feb,Mar,Apr,May,Jun,Jul
1,0,0,0,0,300,400,0
2,0,500,600,700,0,800,0
3,0,0,0,0,0,800,900];
Table1:
CrossTable(Month, Data, 1)
LOAD *
Resident Table;
DROP Table Table;
And then replicated the chart we had initially:
- Mark as New
- Bookmark
- Subscribe
- Mute
- Subscribe to RSS Feed
- Permalink
- Report Inappropriate Content
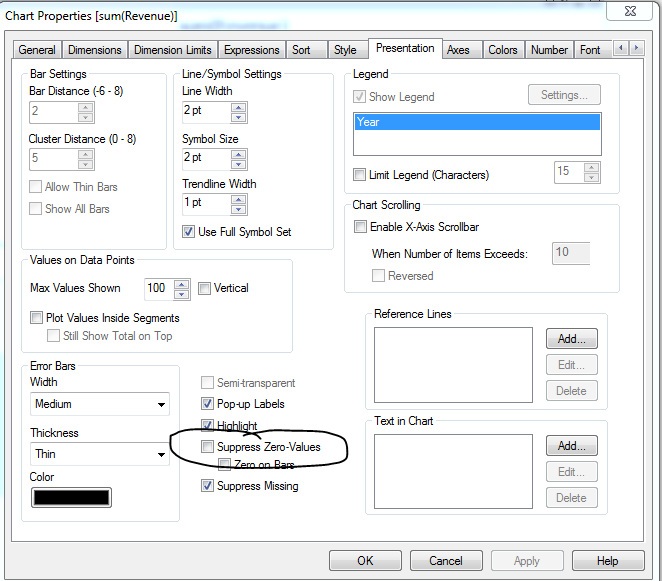
Zero values are being suppressed, in the presentation tab of the properties uncheck the suppress values checkbox
- Mark as New
- Bookmark
- Subscribe
- Mute
- Subscribe to RSS Feed
- Permalink
- Report Inappropriate Content
Is this the requirement?
If yes then just uncheck -> Suppress Zero-Values on the presentation tab
- Mark as New
- Bookmark
- Subscribe
- Mute
- Subscribe to RSS Feed
- Permalink
- Report Inappropriate Content
Thanks,
But for the data its not letting me do that.
PFA
- Mark as New
- Bookmark
- Subscribe
- Mute
- Subscribe to RSS Feed
- Permalink
- Report Inappropriate Content
But for the data its not letting me do that.
What data are you referring to? Nothing is attached?
Best,
Sunny
- Mark as New
- Bookmark
- Subscribe
- Mute
- Subscribe to RSS Feed
- Permalink
- Report Inappropriate Content
Sorry PFA
- Mark as New
- Bookmark
- Subscribe
- Mute
- Subscribe to RSS Feed
- Permalink
- Report Inappropriate Content
Used a CrossTable load to first fix the data in a structure which can be used easily:
Table:
load * inline [
ID, Jan,Feb,Mar,Apr,May,Jun,Jul
1,0,0,0,0,300,400,0
2,0,500,600,700,0,800,0
3,0,0,0,0,0,800,900];
Table1:
CrossTable(Month, Data, 1)
LOAD *
Resident Table;
DROP Table Table;
And then replicated the chart we had initially:
- Mark as New
- Bookmark
- Subscribe
- Mute
- Subscribe to RSS Feed
- Permalink
- Report Inappropriate Content
HI,
Any idea how to have $ sign on Y axis?
I changed the format to money in number tab, but still its the same.
Thanks
- Mark as New
- Bookmark
- Subscribe
- Mute
- Subscribe to RSS Feed
- Permalink
- Report Inappropriate Content
Does this work?
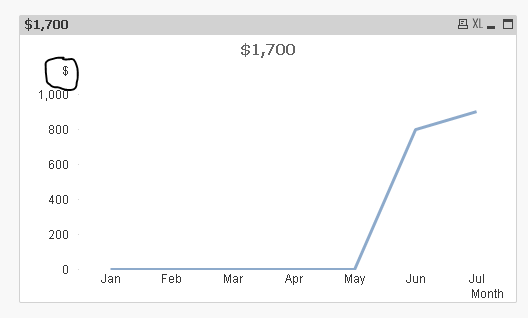
Added it on the Numbers tab:
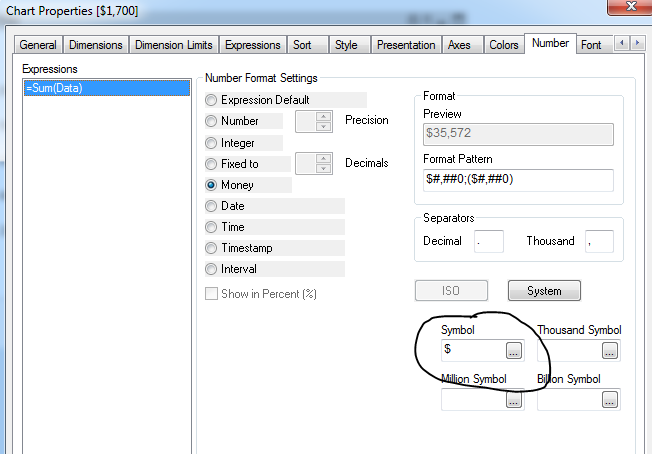
HTH
Best,
Sunny
- Mark as New
- Bookmark
- Subscribe
- Mute
- Subscribe to RSS Feed
- Permalink
- Report Inappropriate Content
Thanks,
But can we have $ sign next to all values on Y axis?
- « Previous Replies
-
- 1
- 2
- Next Replies »