Unlock a world of possibilities! Login now and discover the exclusive benefits awaiting you.

- Qlik Community
- :
- Forums
- :
- Analytics & AI
- :
- Products & Topics
- :
- App Development
- :
- Custom color measurements
- Subscribe to RSS Feed
- Mark Topic as New
- Mark Topic as Read
- Float this Topic for Current User
- Bookmark
- Subscribe
- Mute
- Printer Friendly Page

- Mark as New
- Bookmark
- Subscribe
- Mute
- Subscribe to RSS Feed
- Permalink
- Report Inappropriate Content
Custom color measurements
Hello everybody,
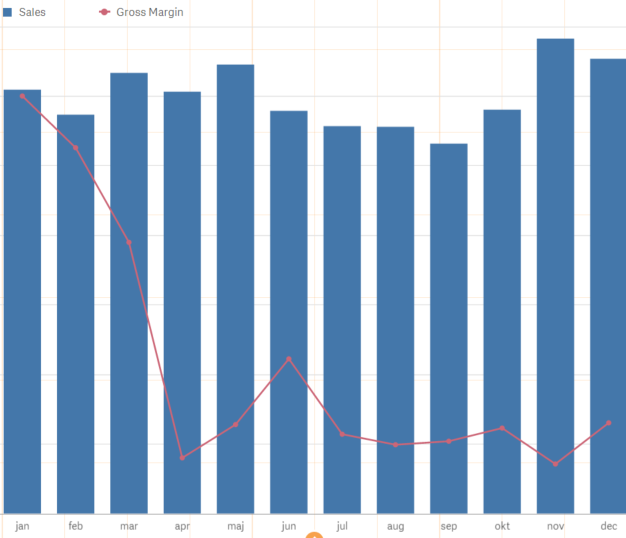
Here comes another color question. I have a chart that looks like this:
I have 1 dimension and 2 measures:
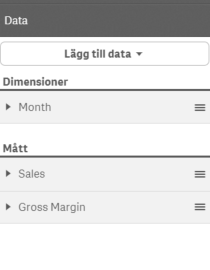
Gross margin is calculated like this:
 (for those who want to know).
I would like to be able to custom color my measure (Gross Margin). Can anyone tell me how to do it?
Sincerely,
Betty Habtemariam

 brunobertels
- Mark as New
- Bookmark
- Subscribe
- Mute
- Subscribe to RSS Feed
- Permalink
- Report Inappropriate Content
Hi Betty
May be somethink like this :
ColorMix1(
((Sum(Sales)-sum(COGS))/Sum(Sales)-$(=min(aggr( ((Sum(Sales)-sum(COGS))/Sum(Sales), [Month])))))
/
$(=(max(aggr(((Sum(Sales)-sum(COGS))/Sum(Sales),[Month]))-min(aggr(((Sum(Sales)-sum(COGS))/Sum(Sales), [Month])))))),white(),blue())
Hope it helps
Bruno
 reddy-s
- Mark as New
- Bookmark
- Subscribe
- Mute
- Subscribe to RSS Feed
- Permalink
- Report Inappropriate Content
Hi Betty,
As you have the gross margin as one of he measures , you will be able to colour code the chart with just an if statement like this:
if( (sum(sales)-sum(cogs))/sum(sales) > 0.5,green(), // greater than 50% green
if( (sum(sales)-sum(cogs))/sum(sales) < 0.2,red(), // less than 20% red
blue())) // else blue
Thanks,
Sangram