Unlock a world of possibilities! Login now and discover the exclusive benefits awaiting you.

Announcements
Share your agentic AI experience, learn from others, and earn a new badge: Put Agentic AI to Work
- Qlik Community
- :
- Forums
- :
- Analytics & AI
- :
- Products & Topics
- :
- App Development
- :
- Data with different Granularity
Options
- Subscribe to RSS Feed
- Mark Topic as New
- Mark Topic as Read
- Float this Topic for Current User
- Bookmark
- Subscribe
- Mute
- Printer Friendly Page
Turn on suggestions
Auto-suggest helps you quickly narrow down your search results by suggesting possible matches as you type.
Showing results for

 kmmqlick
Contributor III
2021-02-03
11:37 AM
- Mark as New
- Bookmark
- Subscribe
- Mute
- Subscribe to RSS Feed
- Permalink
- Report Inappropriate Content
Data with different Granularity
Hi All,
Thanks in advance for your help.
I come across a situation where some data is in moth level and another data in Week level.
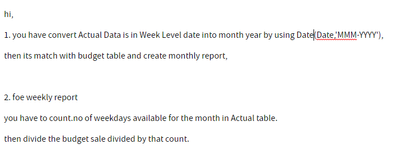
I have two tables Actual in weekly and forecast data in Monthly level. How to handle this type of data in script level and front end?
Example- Actula Data is in Week Level
| Product |
level | Date | Sales |
| A | Actual | 12-12-20 | 400 |
| A | Actual | 19-12-20 | 300 |
| A | Actual | 26-12-20 | 521 |
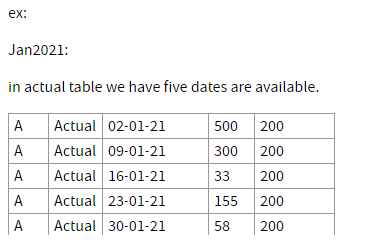
| A | Actual | 02-01-21 | 500 |
| A | Actual | 09-01-21 | 300 |
| A | Actual | 16-01-21 | 33 |
| A | Actual | 23-01-21 | 155 |
| A | Actual | 30-01-21 | 58 |
| Actual | 06-02-21 | 20 |
Forecast table:
| Product | Level | Date | Sales |
| A | Budget | Dec-2020 | 500 |
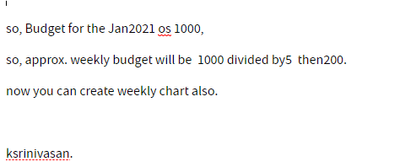
| A | Budget | Jan-2021 | 1000 |
| A | Budget | Feb-2021 | 895 |
| A | Budget | Mar-2021 | 125 |
I want some Bar chat with measure Actual/Budget of net sales like this. In some charts I want show data weekly level in line graph and bar graph. I want to calculate WTD is it possible in this case?
1,030 Views
1 Reply

 Ksrinivasan
Specialist
2021-02-03
12:52 PM
- Mark as New
- Bookmark
- Subscribe
- Mute
- Subscribe to RSS Feed
- Permalink
- Report Inappropriate Content
1,002 Views
